


![[Gamma] Scalping Please](https://ibkrcampus.com/wp-content/smush-webp/2024/04/tir-featured-8-700x394.jpg.webp "[Gamma] Scalping Please")


Guest Authors: Michael Cameron, Martin Vestergaard and Manjeet Mudan of Carmika Partners
Many investors were disappointed by the performance of long volatility strategies during the 2022 market sell off, despite increased realized volatility and an increased Cboe Volatility Index® (VIX® Index) — a benchmark that measures the market expectation of future realized volatility. Hedgers and tail risk funds were similarly dissatisfied. Although the VIX Index measured higher, the S&P 500® Index (SPX) option implied volatility decreased in the latest selloff, resulting in the underperformance of these strategies. However, Carmika Partners’ proprietary volatility model predicted that with SPX skew at all-time highs, a combination of long skew or long volatility was unlikely to work in a market downturn. How could investors have leveraged this model to inform their strategy?
To understand how option implied volatility can decrease as the VIX Index rises, it’s necessary to first understand what the VIX Index represents and its relation to actual option implied volatilities.
The VIX Index is a variance calculation, which means it is a weighted average of out-of-the-money options prices. To a first order approximation, the VIX Index can be thought of as proxy for at-the-money volatility (ATMV) of a constant 30 days to expiry term for S&P 500 Index options. Typically, the VIX Index is around 1.1-1.2 times ATMV. The reason for the spread between the VIX Index and ATMV is the skew of the volatility curve. For example, a 95% out-of-the-money put has a higher value than a 105% out-of-the-money call. The 95% put contributes more to the variance than the 105% call. Additionally, lower strike options are more heavily weighted than higher strike options in the variance calculation by a factor of 1/Strike2.
Figure 1 below shows volatility curves with different skews but the same ATMV, while Figure 2 shows the value of the corresponding VIX Index calculation. When skew is zero, the VIX Index is equal to ATMV. However, as the skew increases, so does the spread between the VIX Index and ATMV.
Figure 1: Implied Volatility Skews
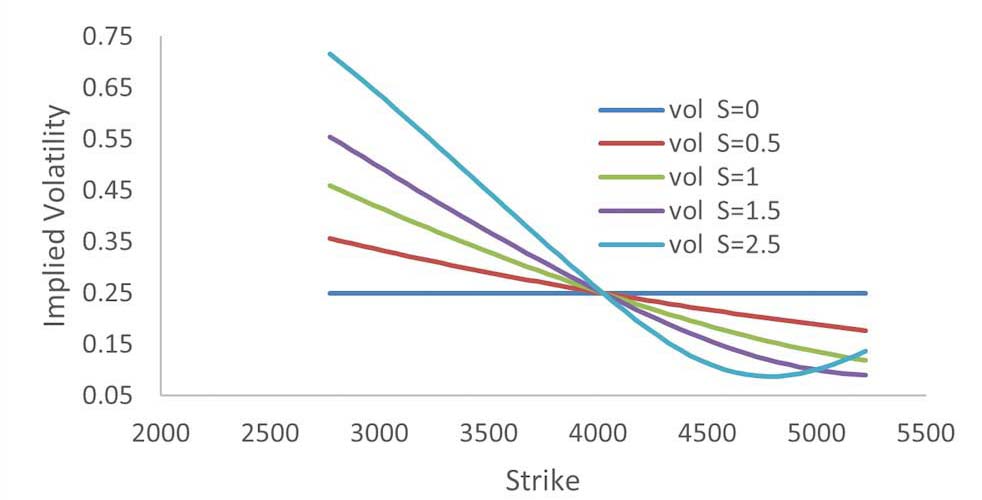
Source: Carmika Partners
Figure 2: VIX (Skew)
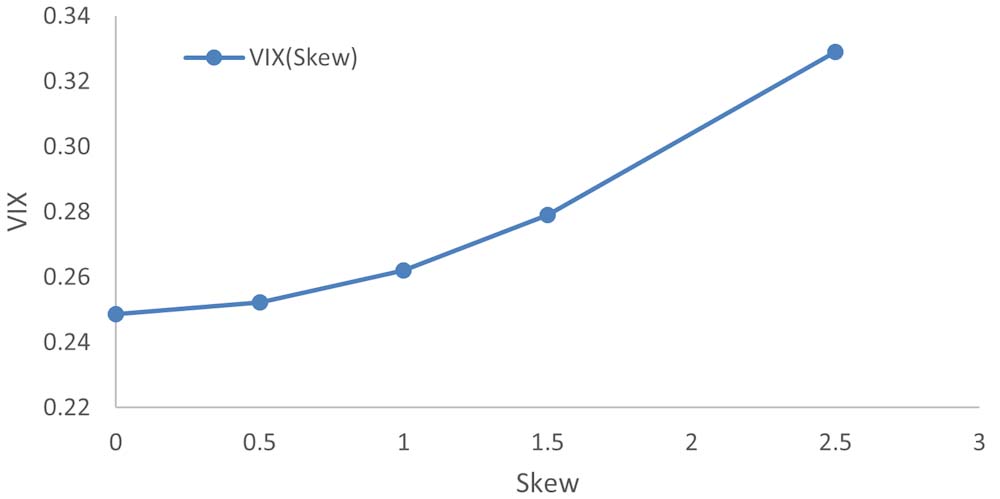
Source: Carmika Partners
In addition to the level of ATMV, the level to skew also impacts the VIX Index. For example, in the case where ATMV is 25% and S is1.5, the level of the VIX Index is 27.9%.
The table below outlines a typical set of option implied volatilities for a series of strikes. If we make the assumption that option implied volatilities are unchanged as the market moves, then if the market fell to 3825, the ATMV would be 29.41 — the implied volatility of the 3825 strike — increasing from 25% to 29.41%. Given that the VIX Index is a proxy for ATMV, it may be expected it to increase by a similar amount, even though actual strike volatility is unchanged.
Table 1: Option Implied Volatilities at Different Strikes
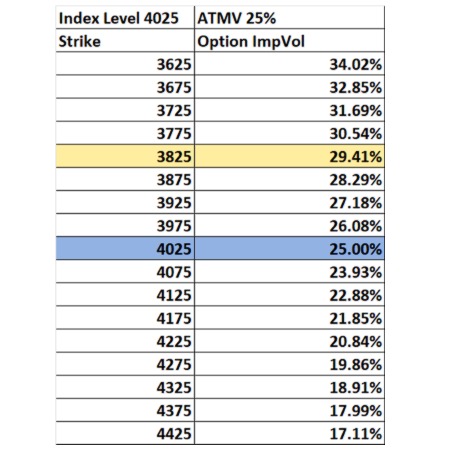
Source: Carmika Partners
There has been a large supply of volatility, or Vega, coming to market throughout this year’s selloff. As a result, the actual strike volatility has gone down. Under these conditions, the strike volatility of the 3825 strike may decrease to 29%. In the hypothetical case used above, if the VIX Index spread to ATMV remains constant, the VIX Index would increase to 31.9%. Additionally, the skew has declined from all-time highs to multi-year lows suppressing the spread between the VIX Index and ATMV. For an investor holding a long volatility, delta-hedged position in the 3825 strike, it is likely the position would actually lose value in the selloff, despite the VIX Index increasing. Figure 3 shows how the interpolated implied volatility of the 3825 strike for a constant 90-day maturity term has declined over the market selloff. This combination of lower volatility and lower skews is one of the main contributors to underperformance from tail risk funds in 2022 so far.
Figure 3: S&P 500 Index 90-Day Strike Volatility
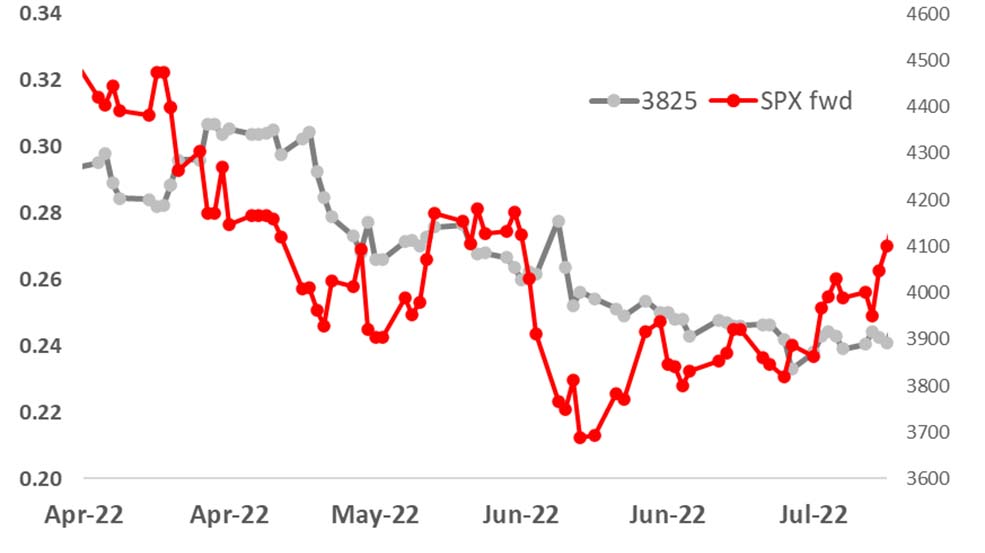
Source: Carmika Partners
Carmika Partners’ proprietary volatility model predicted that with SPX skew at all-time highs, a combination of long skew or long volatility was unlikely to work in a market downturn. This latest market selloff is more evidence that S&P 500 skew provides meaningful insight into investor positioning and behavioral biases. If analyzed correctly, it can help investors mitigate portfolio risks and complement implied volatility as a measure of risk.
Originally Posted October 28, 2022 – How Can Long Volatility Go Down When the VIX Index Goes Up?
This article is part of Cboe’s Guest Author Series, where firms and individuals share their insights, strategies and ideas with the broader Cboe community. Interested in contributing? Email social@cboe.com or contact your Cboe representative to learn more.
There are important risks associated with transacting in any of the Cboe Company products or any of the digital assets discussed here. Before engaging in any transactions in those products or digital assets, it is important for market participants to carefully review the disclosures and disclaimers contained at: https://www.cboe.com/us_disclaimers/. The views expressed herein are those of the author and do not necessarily reflect the views of Cboe Global Markets, Inc. or any of its affiliates.
Disclosure: Cboe Global Markets
Options involve risk and are not suitable for all investors. Prior to buying or selling an option, a person must receive a copy of Characteristics and Risks of Standardized Options. Copies are available from your broker, or at www.theocc.com. The information in this program is provided solely for general education and information purposes. No statement within the program should be construed as a recommendation to buy or sell a security or to provide investment advice. The opinions expressed in this program are solely the opinions of the participants, and do not necessarily reflect the opinions of Cboe or any of its subsidiaries or affiliates. You agree that under no circumstances will Cboe or its affiliates, or their respective directors, officers, trading permit holders, employees, and agents, be liable for any loss or damage caused by your reliance on information obtained from the program.
Copyright © 2023 Chicago Board Options Exchange, Incorporated. All rights reserved.
Disclosure: Interactive Brokers
Information posted on IBKR Campus that is provided by third-parties does NOT constitute a recommendation that you should contract for the services of that third party. Third-party participants who contribute to IBKR Campus are independent of Interactive Brokers and Interactive Brokers does not make any representations or warranties concerning the services offered, their past or future performance, or the accuracy of the information provided by the third party. Past performance is no guarantee of future results.
This material is from Cboe Global Markets and is being posted with its permission. The views expressed in this material are solely those of the author and/or Cboe Global Markets and Interactive Brokers is not endorsing or recommending any investment or trading discussed in the material. This material is not and should not be construed as an offer to buy or sell any security. It should not be construed as research or investment advice or a recommendation to buy, sell or hold any security or commodity. This material does not and is not intended to take into account the particular financial conditions, investment objectives or requirements of individual customers. Before acting on this material, you should consider whether it is suitable for your particular circumstances and, as necessary, seek professional advice.
Disclosure: Options Trading
Options involve risk and are not suitable for all investors. Multiple leg strategies, including spreads, will incur multiple commission charges. For more information read the "Characteristics and Risks of Standardized Options" also known as the options disclosure document (ODD) or visit ibkr.com/occ

