Among the more popular stock-specific news items today are stories about a potential “death cross” in Tesla (TSLA). A death cross is a concept from technical analysis that has become popular within the financial media. The term is certainly eye-catching, but the concept behind it is far more mundane.
When the 50 day moving average of a stock, commodity or index crosses below the 200 day moving average of that item, it is said to have formed a “death cross”. Let’s be blunt here. “Death cross” sounds far more interesting than “50/200 day moving average cross”. Traders can and do find it notable when moving averages cross. Crosses can confirm trends, which many momentum-focused traders find useful. In the case of the “death cross”, we are looking at relatively long-term trends, which are likely to be more important to investment decisions than to short-term trading. Bear in mind that moving averages measure trading sessions, not calendar days. For equities, that means that a 50 day average measures about 2.5 months and a 200 day average measures about a 10 month period.
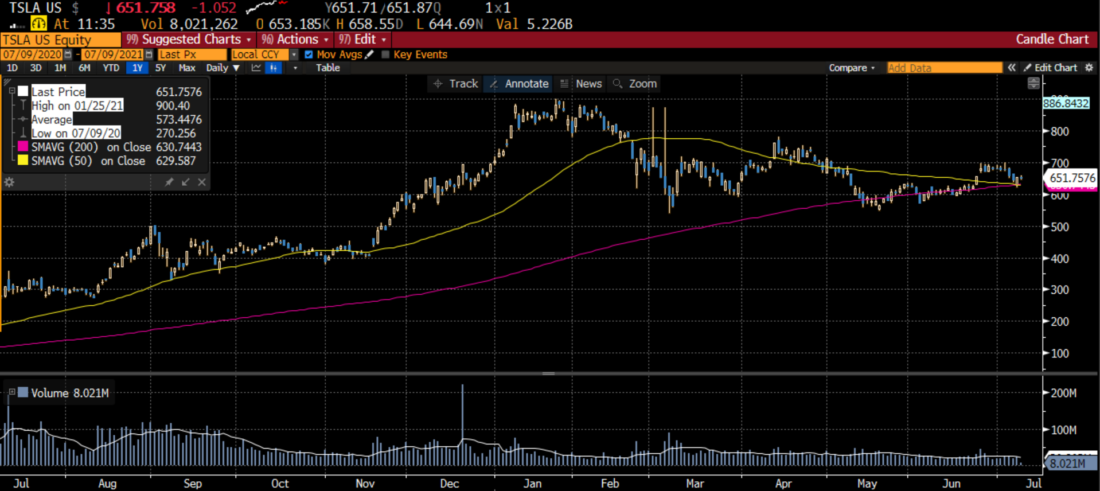
The biggest problem for death cross watchers is that a “death cross” is far more meaningful when both moving averages are pointing down. Right now the 200 day moving average is still trending higher, as evidenced in the chart below:
TSLA 1 Year Daily Candle Chart with 50 (yellow) and 200 Day (blue) Moving Averages, with Volume (bottom)

Source: Bloomberg
We see that the magenta line (the 200 day moving average) is rising. It is likely to do so as long as the current TSLA price remains above the levels where it was 200 trading days ago. The earliest values in the 200 day moving average are from mid-September. If TSLA stays around its present price, we are replacing lower values from September with higher current ones. That implies a rising 200 day moving average. Note that it was only in early December that the stock rose above its current price.
It is important to remember the math behind simple moving averages. When you construct a moving average of X days, each day you replace the value from X+1 days ago with today’s value. If today’s value is higher, then moving average increases (and vice versa).
Even if TSLA’s price remains constant, the 200 day should keep rising for about 2.5 months (about 55 trading or 80 calendar days). That is because we would be replacing lower old values with higher new ones. This is not a prediction, it’s arithmetic.
Barring a meaningful drop in TSLA – which could happen for many reasons, but not simply a death cross – we are likely to see a rising 200 day moving average. That defines an uptrend. When we look at the chart, we see that the 200 day has been solid support for TSLA since May. That bodes reasonably for the stock as long as it continues to ride that gently rising trend line. However, if some exogenous factor causes TSLA’s stock price to break down, we can see real technical weakness and an eventual dip in the 200 day. Then, and only then, would the “death cross” be a meaningful technical indicator for TSLA.
Disclosure: Interactive Brokers
The analysis in this material is provided for information only and is not and should not be construed as an offer to sell or the solicitation of an offer to buy any security. To the extent that this material discusses general market activity, industry or sector trends or other broad-based economic or political conditions, it should not be construed as research or investment advice. To the extent that it includes references to specific securities, commodities, currencies, or other instruments, those references do not constitute a recommendation by IBKR to buy, sell or hold such investments. This material does not and is not intended to take into account the particular financial conditions, investment objectives or requirements of individual customers. Before acting on this material, you should consider whether it is suitable for your particular circumstances and, as necessary, seek professional advice.
The views and opinions expressed herein are those of the author and do not necessarily reflect the views of Interactive Brokers, its affiliates, or its employees.


