


Despite outperforming their large-cap peers over longer time periods, small- and mid-cap stocks have suffered a recent stretch of underperformance. As a result of this large-cap dominance over several years, many investors are likely under-allocated to smaller capitalization stocks. This year’s market drawdowns can be an opportunity for market participants to reconsider and potentially reset or fine-tune their portfolio asset allocations—signs point to a potential rebound for smaller capitalization stocks.
Smaller-cap stocks are in the bargain bin
Investors might be hard pressed to find any silver linings amidst the wreckage of the current market downturn. High levels of inflation, tightening monetary policy, and the ongoing conflict abroad are a potent combination that has left investor sentiment understandably in the dumps. But despite the dour mood, improving valuations are becoming hard to ignore.
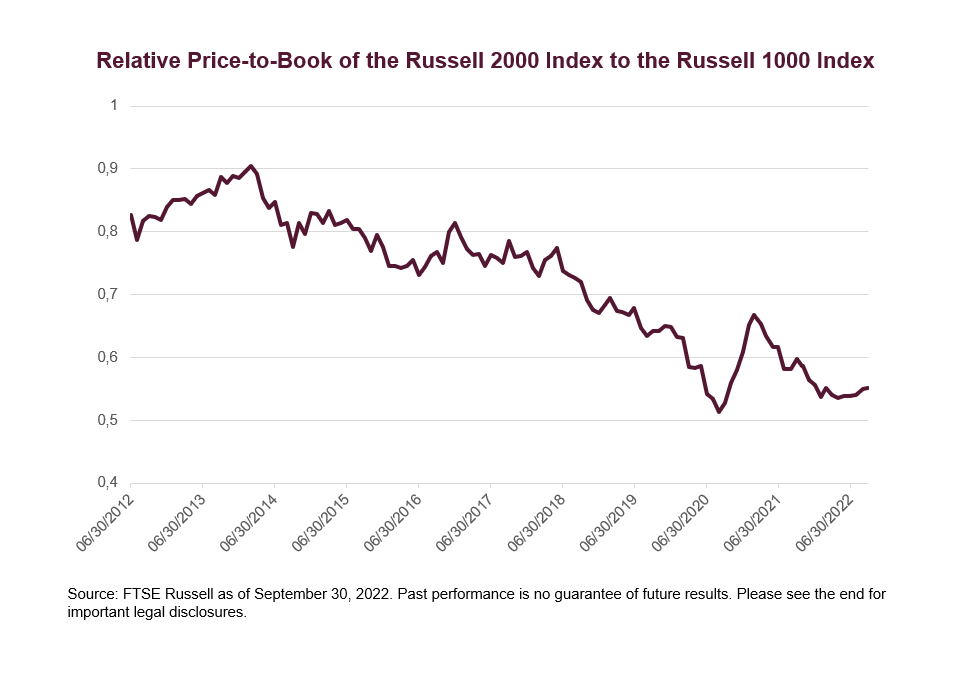
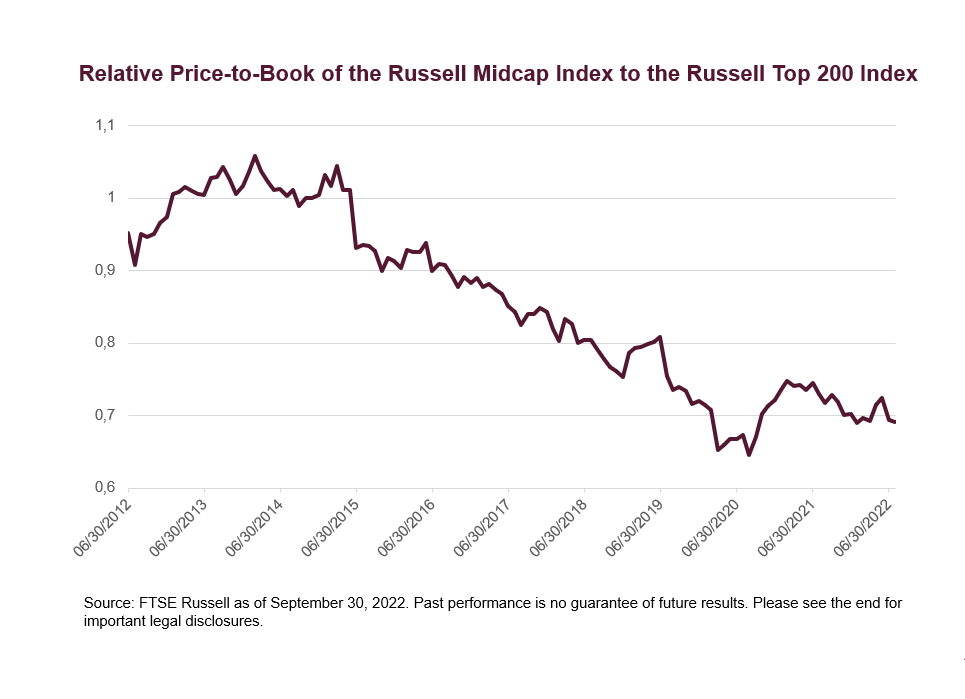
While recent price weakness has left large-cap valuation metrics below their recent three-year averages, small- and mid-cap stocks offer an even more compelling value. Relative to large caps, price-to-book ratios for smaller stocks are trading at roughly half of large caps.
While it’s difficult to predict exactly when the valuation gap may begin to close, one potential catalyst could be continued earnings strength. As shown, analysts expect both small and mid-caps to deliver better earnings than large caps in the year ahead.
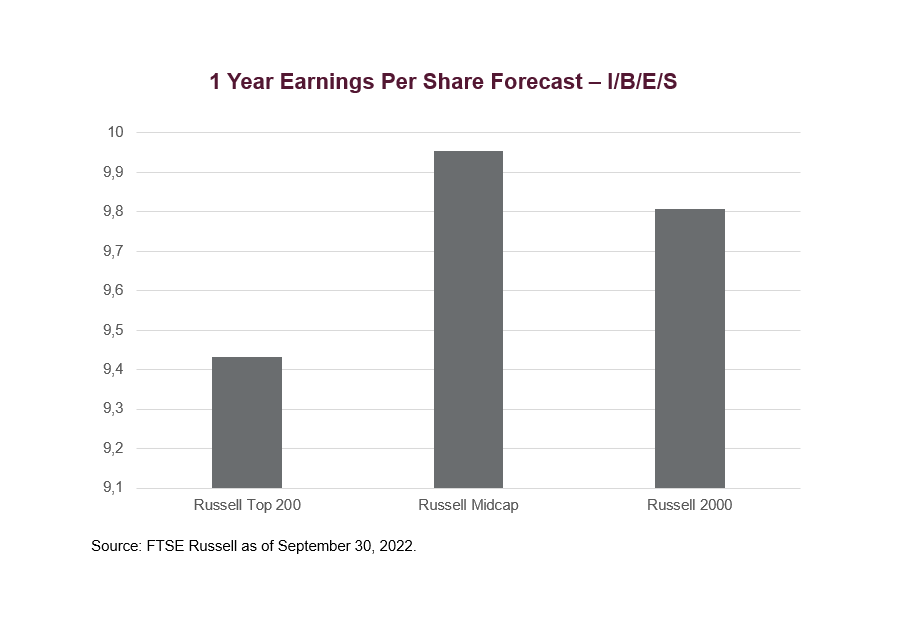
Of course, it’s important to note some potential variables in these forecasts. For one, small-cap stocks generally have thinner analyst coverage, so earnings estimates tend to be more volatile. And if the economy slips into a recession, the earnings picture could change materially. Nonetheless, current forecasts for the remainder of the year project robust growth.
Smaller-cap stocks have historically performed well during rising rates
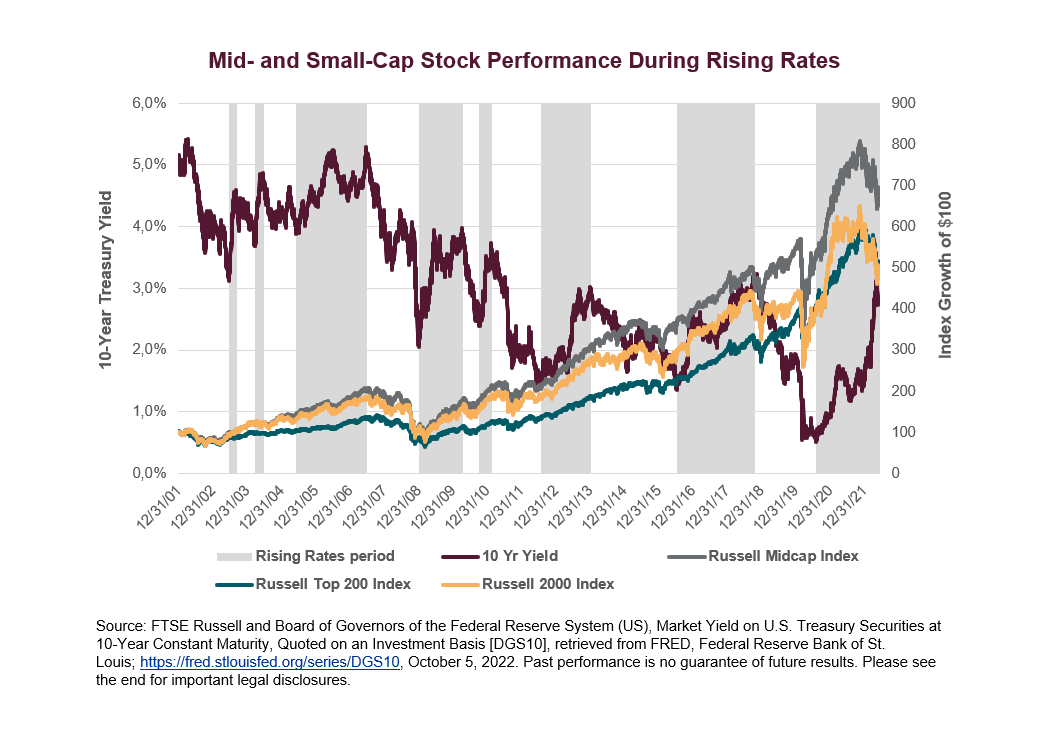
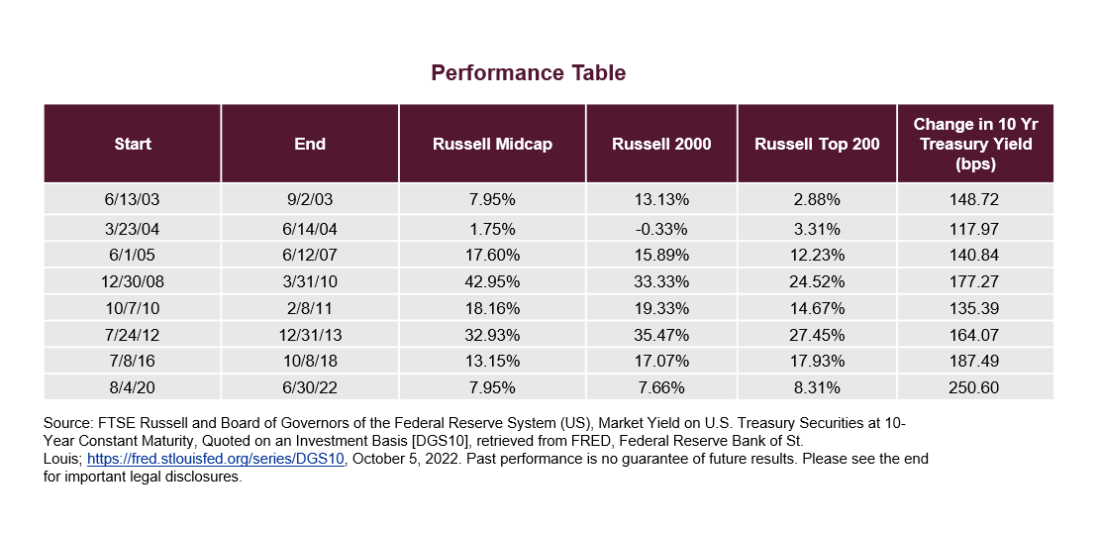
Many have blamed a hawkish Fed and a more than 200 basis points [1] increase in 10-year Treasury yields since January for recent equity market weakness. Indeed, the long-term relationship between stocks and rates is mixed. But stocks have performed well during prior rising rate environments, especially during more recent periods.
In the past, there’s typically been a perception that companies with smaller market capitalizations are more leveraged than large caps and may face difficulties servicing their debt as rates rise. However, performance hasn’t always followed that narrative. Small- and mid-cap stocks have, in fact, outperformed large caps during the vast majority of recent rising rate environments.
Smaller cap stocks also get more of their revenues from within the US compared to larger cap stocks, and thus smaller cap stocks may be less susceptible to revenue volatility stemming from international turmoil.
Dividend growers have better-weathered market turbulence
When markets are volatile, many investors seek refuge in strategies with a history of weathering market turbulence. One formula for investors seeking outperformance can be fleeing to quality when markets are volatile.
Companies that have continuously grown their dividends over time are typically seen as high quality with stable earnings, solid fundamentals, and strong histories of profit and growth. While often thought of as exclusively large-cap household names, dividend growers are also found among small- and mid-cap stocks.
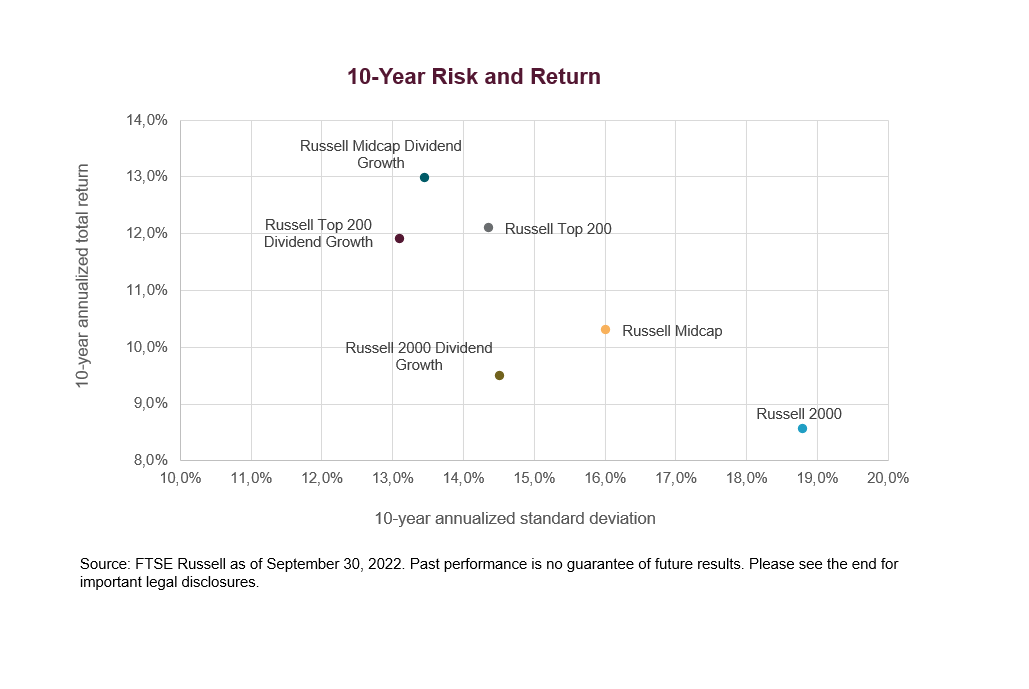
The Russell Midcap Dividend Growth Index and the Russell 2000 Dividend Growth Index—a group of mid-and small-cap stocks, respectively, that have grown dividends for at least 10 consecutive years—have delivered lower risk and higher returns relative to their traditional counterparts over the past ten years. The Russell Top 200 Dividend Growth Index has had lower volatility compared to the Russell Top 200 Index, too, with similar levels of returns.
Shelter from the storm?
While large-cap stocks have enjoyed a good run relative to smaller-cap stocks, there are several signals that a reversal of fortune could be on the horizon. And investors seeking shelter from today’s market turbulence might find that high-quality small- and mid-cap dividend growth indexes are particularly well-positioned to weather the storm.
For more information smaller-cap stocks, subscribe to our blog.
[1] As of 9/30/22.
—
Originally Posted October 21, 2022 – Are smaller-cap stocks due for a rebound?
Disclosure: FTSE Russell
Interactive Advisors, a division of Interactive Brokers Group, offers FTSE Russell Index Tracker portfolios on its online investing marketplace. Learn more about the Diversified Portfolios.
This material is not intended as investment advice. Interactive Advisors or portfolio managers on its marketplace may hold long or short positions in the companies mentioned through stocks, options or other securities.
© 2023 London Stock Exchange Group plc and its applicable group undertakings (the “LSE Group”). The LSE Group includes (1) FTSE International Limited (“FTSE”), (2) Frank Russell Company (“Russell”), (3) FTSE Global Debt Capital Markets Inc. and FTSE Global Debt Capital Markets Limited (together, “FTSE Canada”), (4) MTSNext Limited (“MTSNext”), (5) Mergent, Inc. (“Mergent”), (6) FTSE Fixed Income LLC (“FTSE FI”), (7) The Yield Book Inc (“YB”) and (8) Beyond Ratings S.A.S. (“BR”). All rights reserved.
FTSE Russell® is a trading name of FTSE, Russell, FTSE Canada, MTSNext, Mergent, FTSE FI, YB and BR. “FTSE®”, “Russell®”, “FTSE Russell®”, “MTS®”, “FTSE4Good®”, “ICB®”, “Mergent®”, “The Yield Book®”, “Beyond Ratings®“ and all other trademarks and service marks used herein (whether registered or unregistered) are trademarks and/or service marks owned or licensed by the applicable member of the LSE Group or their respective licensors and are owned, or used under licence, by FTSE, Russell, MTSNext, FTSE Canada, Mergent, FTSE FI, YB or BR. FTSE International Limited is authorised and regulated by the Financial Conduct Authority as a benchmark administrator.
All information is provided for information purposes only. All information and data contained in this publication is obtained by the LSE Group, from sources believed by it to be accurate and reliable. Because of the possibility of human and mechanical error as well as other factors, however, such information and data is provided “as is” without warranty of any kind. No member of the LSE Group nor their respective directors, officers, employees, partners or licensors make any claim, prediction, warranty or representation whatsoever, expressly or impliedly, either as to the accuracy, timeliness, completeness, merchantability of any information or of results to be obtained from the use of the FTSE Russell products, including but not limited to indexes, data and analytics or the fitness or suitability of the FTSE Russell products for any particular purpose to which they might be put. Any representation of historical data accessible through FTSE Russell products is provided for information purposes only and is not a reliable indicator of future performance.
No responsibility or liability can be accepted by any member of the LSE Group nor their respective directors, officers, employees, partners or licensors for (a) any loss or damage in whole or in part caused by, resulting from, or relating to any error (negligent or otherwise) or other circumstance involved in procuring, collecting, compiling, interpreting, analysing, editing, transcribing, transmitting, communicating or delivering any such information or data or from use of this document or links to this document or (b) any direct, indirect, special, consequential or incidental damages whatsoever, even if any member of the LSE Group is advised in advance of the possibility of such damages, resulting from the use of, or inability to use, such information.
No member of the LSE Group nor their respective directors, officers, employees, partners or licensors provide investment advice and nothing contained herein or accessible through FTSE Russell products, including statistical data and industry reports, should be taken as constituting financial or investment advice or a financial promotion.
Past performance is no guarantee of future results. Charts and graphs are provided for illustrative purposes only. Index returns shown may not represent the results of the actual trading of investable assets. Certain returns shown may reflect back-tested performance. All performance presented prior to the index inception date is back-tested performance. Back-tested performance is not actual performance, but is hypothetical. The back-test calculations are based on the same methodology that was in effect when the index was officially launched. However, back- tested data may reflect the application of the index methodology with the benefit of hindsight, and the historic calculations of an index may change from month to month based on revisions to the underlying economic data used in the calculation of the index.
This document may contain forward-looking assessments. These are based upon a number of assumptions concerning future conditions that ultimately may prove to be inaccurate. Such forward-looking assessments are subject to risks and uncertainties and may be affected by various factors that may cause actual results to differ materially. No member of the LSE Group nor their licensors assume any duty to and do not undertake to update forward-looking assessments.
No part of this information may be reproduced, stored in a retrieval system or transmitted in any form or by any means, electronic, mechanical, photocopying, recording or otherwise, without prior written permission of the applicable member of the LSE Group. Use and distribution of the LSE Group data requires a licence from FTSE, Russell, FTSE Canada, MTSNext, Mergent, FTSE FI, YB, BR and/or their respective licensors.
Disclosure: Interactive Brokers
Information posted on IBKR Campus that is provided by third-parties does NOT constitute a recommendation that you should contract for the services of that third party. Third-party participants who contribute to IBKR Campus are independent of Interactive Brokers and Interactive Brokers does not make any representations or warranties concerning the services offered, their past or future performance, or the accuracy of the information provided by the third party. Past performance is no guarantee of future results.
This material is from FTSE Russell and is being posted with its permission. The views expressed in this material are solely those of the author and/or FTSE Russell and Interactive Brokers is not endorsing or recommending any investment or trading discussed in the material. This material is not and should not be construed as an offer to buy or sell any security. It should not be construed as research or investment advice or a recommendation to buy, sell or hold any security or commodity. This material does not and is not intended to take into account the particular financial conditions, investment objectives or requirements of individual customers. Before acting on this material, you should consider whether it is suitable for your particular circumstances and, as necessary, seek professional advice.

