


![[Gamma] Scalping Please](https://ibkrcampus.com/wp-content/smush-webp/2024/04/tir-featured-8-700x394.jpg.webp "[Gamma] Scalping Please")


This holiday season it will not only be catching our desired item that will be our biggest concern, but we will also have to navigate through supply-chain complications that have caused delays and shortages among retailers. This may result in increasing costs and less attractive promotions during the most anticipated non-official US holiday that will kick off this year’s Christmas shopping season – “Black Friday”.
Black Friday falls to the first Friday after Thanksgiving. The term has its origins in accounting. When accounting records were kept by hand, red ink indicated a loss, and black a profit. Traditionally, during this period stores move from the “red” to the “black”.
There are stock traders who associate Black Friday with the stock market collapse of September 24, 1869. The price of gold plummeted and the markets crashed in the wake of a conspiracy between two investors, Jay Gould and James Fisk. However, in today’s issue we are discussing Black Friday in line with optimistic connotations!
The Battle for the Consumer Dollars Begins
For millions of people, Black Friday is the time to do some serious shopping. It embodies one of the most important retail and consumer spending events in the United States. Indeed, since 2005, Black Friday has reportedly been the busiest shopping day of the year in the States. Sales figures posted for this time period set the tone for the entire retail sector.
According to Adobe, last year customers spent $9 billion on the internet, increasing sales 21.6% year-over-year. This clearly underscores last year’s shift from in-store to online sales.
By offering various discounts and bargains, shopping retailers try to make their products even more appealing to potential customers. This year online retailers will again enjoy a comparative advantage over traditional retail shops, who will still need to navigate in store social distancing rules. Moreover, whilst some traditional stores such as Target and Walmart have successfully transitioned to online shopping, smaller chains may struggle to secure enough stock due to supply-chain bottlenecks. This may result in increasing costs and less attractive promotions being offered.
From a statistical perspective, there is a clear upward spike in the S&P 500 Index shortly before and after Black Friday. In other words, the S&P 500 Index typically delivers strong seasonal returns shortly before and after Black Friday.
Seasonal Chart of the S&P 500 Index over the past 15 years
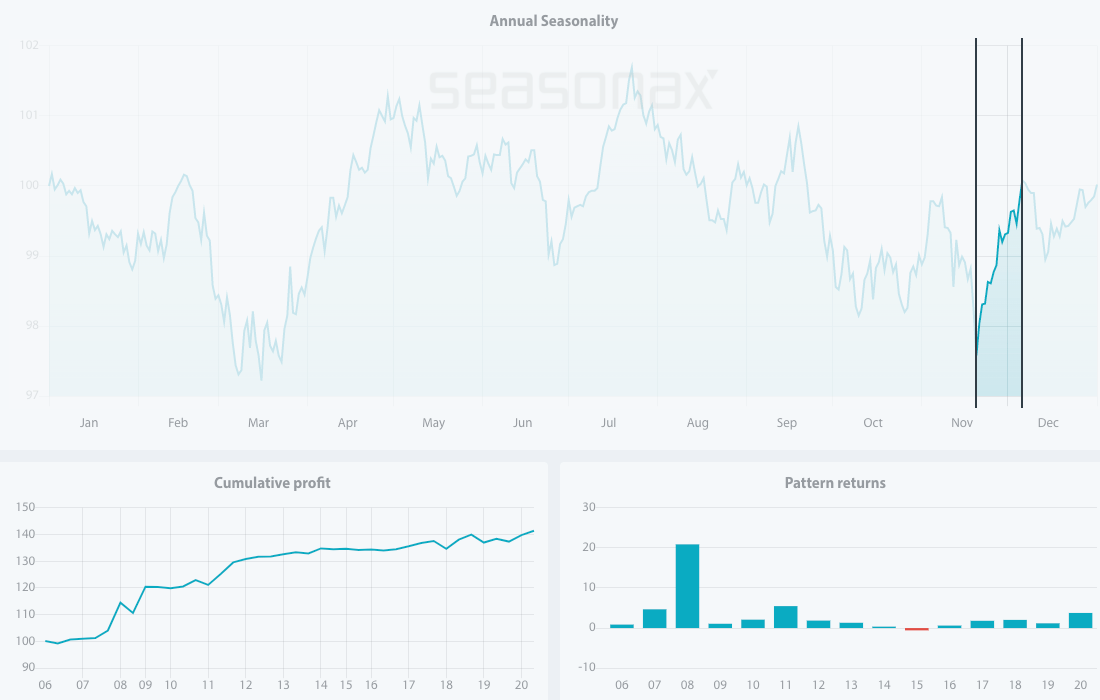
Source: Seasonax
You can take a closer look at a detailed statistical analysis of this pattern by clicking on the interactive link above, and highlighting the above mentioned period on the chart.
Unlike a standard price chart that simply shows stock prices over a specific time period, a seasonal chart depicts the average price pattern of a stock (or index) in the course of a calendar year, calculated over several years. The horizontal axis depicts the time of the year, while the vertical axis shows the level of the seasonal pattern (indexed to 100). With that in mind, let us examine the seasonal chart of the S&P 500 Index.
I have highlighted the strong seasonal phase from November 20 to December 6 calculated over the past 15 years. In this time span, of just 11 trading days, the S&P 500 Index rose on average by 3.07%. On an annualized basis, this is equivalent to a significant gain of 97.62%.
Which Stocks to Pick?
This year, when considering where to invest, you should take into account the global semiconductor shortage. Although the car industry has suffered the most, the shortage has also affected all kinds of consumer electronics: computers through to tumble dryers, and even items such as electric toothbrushes.
With this in mind, I decided to use Stock Screener to identify stocks that have performed well in the last 15 years during, and after, Black Friday fever. Depending on my preferences, the Screener enables me to screen different instruments for upcoming profitable patterns. First of all, I have analysed different S&P 500 Index sectors with the highest probability of pattern recurrence from November 23 onwards. I have used the history of the last 15 years, and time holding stocks period length of 60 to 90 days, starting from November 23.

Source: Seasonax Seasonality Screener
Consumer Discretionary, Industrials, Health Care and Utilities ranked as the top 4 S&P 500 sectors. This ranking was based on the annualized average return and win ratio over 80%, meaning that all trades that have not brought profits at least 80% of the time in the last 15 years were removed, during the mentioned period.
Going into even more detail, I have screened for the leading stock opportunities within the S&P 500 Consumer Discretionary sector, with at least 85% pattern reoccurrence within the last 15 years starting from November 23.These are the highest ranked results within S&P 500 Consumer Discretionary sector, starting from November 23:

Source: Seasonax Seasonality Screener
Ranking highly are Lennar Corporation, D.R Horton, Lowe’s Companies, Booking Holdings, Ross Stores, Chipotle Mexican Grill and Marriott International. Will this trend be repeated? We will see shortly.
Let us further examine Lowe’s Corporation, an US retail company specializing in home improvement, that has delivered strong seasonal returns in only 64 days (pattern starts on November 23 and ends on January 26 – as shown in the table above).
Seasonal Chart of the Lowe’s Corporation over the past 15 years
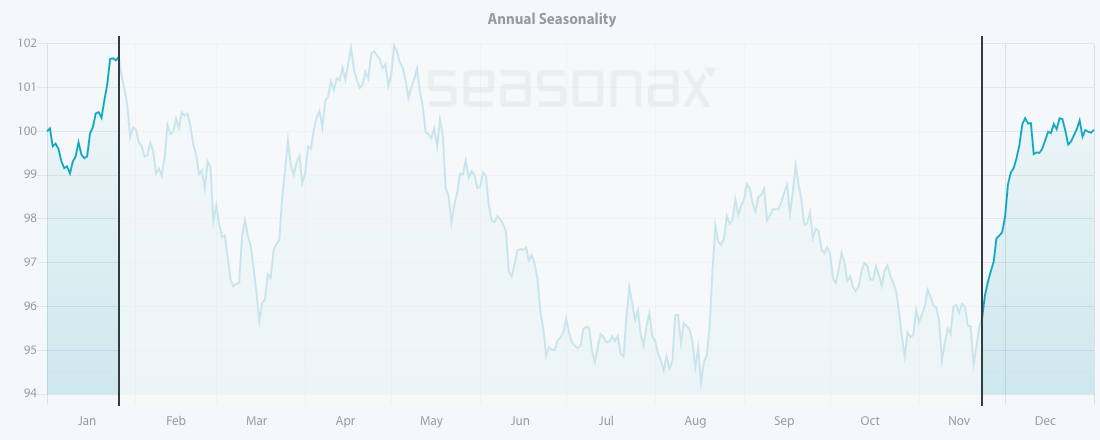
Source: Seasonax – click on the chart to adjust entry and exit dates in order to conduct further analysis.
The frequency of positive returns generated over time during this phase indicates that the seasonal pattern is consistent and highly reliable.
The bar chart below depicts the return delivered by Lowe’s Corporation in the relevant time period from November 23 to January 26 in every year since 2006. Blue bars indicate years with positive returns.
Pattern returns for every year since 2006
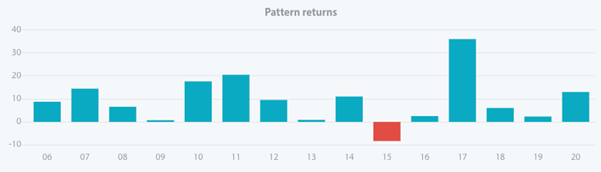
Source: Seasonax – click on the chart to conduct further analysis
Please keep in mind that past results and past seasonal patterns are no indication of future performance, in particular future market trends. To analyse all other sectors and more than 25,000+ instruments, including stocks, (crypto)currencies, commodities and indexes, feel free to make use of our 3 days free trial.
Whilst undoubtedly the holidays are the most important period of the year for retailers, there are also current market situations to take into account, not least as the number of people infected with the virus again continues to grow.
Regardless of how Black Friday turns out this year, shopping euphoria should eclipse this year’s market rollercoaster, at least for a brief moment.
Tea Muratovic
Co-Founder and Managing Partner of Seasonax
—
Originally Posted on November 17, 2021 – Black Friday – Shopping Euphoria on The Stock Market
Disclosure: Seasonax
Past results and past seasonal patterns are no indication of future performance, in particular, future market trends. Seasonax GmbH neither recommends nor approves of any particular financial instrument, group of securities, segment of industry, analysis interval or any particular idea, approach, strategy or attitude nor provides consulting nor brokerage nor asset management services. Seasonax GmbH hereby excludes any explicit or implied trading recommendation, in particular, any promise, implication or guarantee that profits are earned and losses excluded, provided, however, that in case of doubt, these terms shall be interpreted in abroad sense. Any information provided by Seasonax GmbH or on this website or any other kind of data media shall not be construed as any kind of guarantee, warranty or representation, in particular as set forth in a prospectus. Any user is solely responsible for the results or the trading strategy that is created, developed or applied. Indicators, trading strategies and functions provided by seasonax GmbH or on this website or any other kind of data media may contain logical or other errors leading to unexpected results, faulty trading signals and/or substantial losses. Seasonax GmbH neither warrants nor guarantees the accuracy, completeness, quality, adequacy or content of the information provided by it or on this website or any other kind of data media. Any user is obligated to comply with any applicable capital market rules of the applicable jurisdiction. All published content and images on this website or any other kind of data media are protected by copyright. Any duplication, processing, distribution or any form of utilisation beyond the scope of copyright law shall require the prior written consent of the author or authors in question. Futures and forex trading contains substantial risk and is not for every investor. An investor could potentially lose all or more than the initial investment. Risk capital is money that can be lost without jeopardizing ones’ financial security or lifestyle. Only risk capital should be used for trading and only those with sufficient risk capital should consider trading. Past performance is not necessarily indicative of future results. Testimonials appearing on this website may not be representative of other clients or customers and is not a guarantee of future performance or success.
Disclosure: Interactive Brokers
Information posted on IBKR Campus that is provided by third-parties does NOT constitute a recommendation that you should contract for the services of that third party. Third-party participants who contribute to IBKR Campus are independent of Interactive Brokers and Interactive Brokers does not make any representations or warranties concerning the services offered, their past or future performance, or the accuracy of the information provided by the third party. Past performance is no guarantee of future results.
This material is from Seasonax and is being posted with its permission. The views expressed in this material are solely those of the author and/or Seasonax and Interactive Brokers is not endorsing or recommending any investment or trading discussed in the material. This material is not and should not be construed as an offer to buy or sell any security. It should not be construed as research or investment advice or a recommendation to buy, sell or hold any security or commodity. This material does not and is not intended to take into account the particular financial conditions, investment objectives or requirements of individual customers. Before acting on this material, you should consider whether it is suitable for your particular circumstances and, as necessary, seek professional advice.


![[Gamma] Scalping Please](https://ibkrcampus.com/wp-content/smush-webp/2024/04/tir-featured-8-300x169.jpg.webp "[Gamma] Scalping Please")