


")


It is widely agreed that value stocks have been outperforming growth stocks since the bear market started in January 2022. The reasons cited for this trend in favor of value are many and varied, not the least of which of course is the spike in interest rates. Ratchet up the discount rate, and valuations come down, especially when the starting point for valuations is at or near record levels.
Still, I want to repeat a rather controversial notion, one which usually generates a lot of push back. It is my belief that “value” never actually works as a strategy. In other words, stocks don’t just all of a sudden start to go up just because they are “cheap”.
No, it is my belief that cheap stocks start to go up because their fundamentals start to get better. Without that fundamental catalyst to unlock the “perceived” value, cheap stocks just stay cheap. These are what we affectionately refer to as “value traps”.
Furthermore, growth stocks don’t stop going up just because they are expensive. They stop going up because the second derivative of growth slows down, especially relative to the high expectations that are baked into the lofty valuation. Therefore, I believe that as long as expectations are met or exceeded, growth stocks can continue to work, regardless of valuations.
Unfortunately, when growth stocks eventually do breakdown, value-minded investors tend to view that pullback as an opportunity to finally buy those prized growth stocks at a reasonably discounted price. Of course, lacking the necessary growth catalyst (either relative to expectations, alternatives, or both), those former high flyers continue to underperform, often while still delivering rapid growth. One might call these “growth traps”.
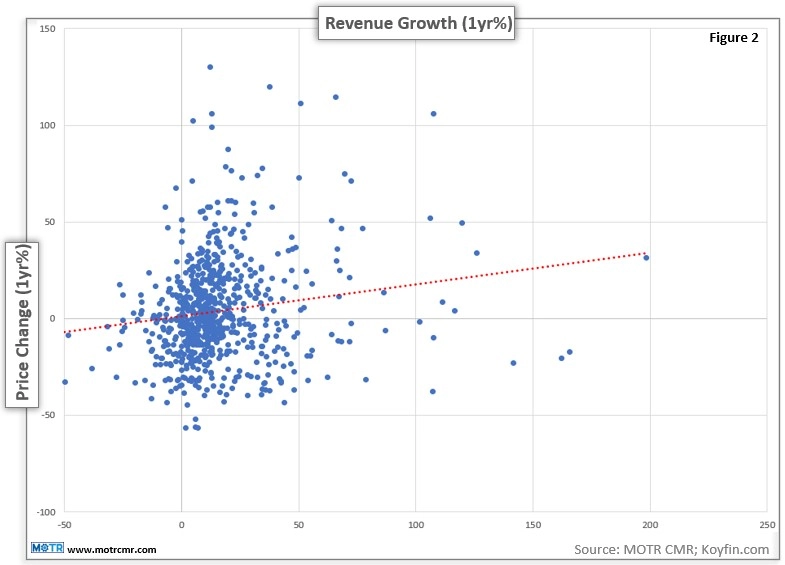
To demonstrate my point, Figure 2 is a scatter plot of recent trailing 1 year revenue growth (x-axis) and trailing 1 year price change (y-axis). What appears to be the case is that stocks with the best revenue growth over the past year have recorded the best 1 year price changes, and vice versa. This is revealed by the red, upward sloping best fit line. For purposes of this analysis, I started with the top 1000 market cap companies, then eliminated stocks below $20 and low/no revenue growth companies to address the “low base” effect in both cases. This of course, removed most smaller biotech companies.
This is not at all to say that the best performing companies weren’t “cheap” at the start of the bear market. Honestly, I have no idea. I don’t personally know how to properly define “value”, per se. Therefore, to stay out of trouble, I don’t even try.
However, I would venture to say that whatever stocks have outperformed over the past year, they were likely “cheaper” a year ago than they are today. From that perspective, I guess “value has been working”, but I would argue, thanks to strong and/or improving topline revenue growth, not because they were “cheaper” a year ago.
—
Originally Posted May 5, 2023 – Charting My Interruption (CMI): “Value is outperforming, but not really.”
Disclosure: Interactive Brokers
Information posted on IBKR Campus that is provided by third-parties does NOT constitute a recommendation that you should contract for the services of that third party. Third-party participants who contribute to IBKR Campus are independent of Interactive Brokers and Interactive Brokers does not make any representations or warranties concerning the services offered, their past or future performance, or the accuracy of the information provided by the third party. Past performance is no guarantee of future results.
This material is from MOTR Capital Management & Research and is being posted with its permission. The views expressed in this material are solely those of the author and/or MOTR Capital Management & Research and Interactive Brokers is not endorsing or recommending any investment or trading discussed in the material. This material is not and should not be construed as an offer to buy or sell any security. It should not be construed as research or investment advice or a recommendation to buy, sell or hold any security or commodity. This material does not and is not intended to take into account the particular financial conditions, investment objectives or requirements of individual customers. Before acting on this material, you should consider whether it is suitable for your particular circumstances and, as necessary, seek professional advice.


Join The Conversation
If you have a general question, it may already be covered in our FAQs. If you have an account-specific question or concern, please reach out to Client Services.