


![[Gamma] Scalping Please](https://ibkrcampus.com/wp-content/smush-webp/2024/04/tir-featured-8-700x394.jpg.webp "[Gamma] Scalping Please")


Last week was fascinating and historic. It was widely reported that equity indices in the US had their best week in decades. While I am always fascinated by market anomalies, it is more relevant to see what happened in the sessions after similar moves higher. What occurred last week is now behind us; traders and investors must be forward looking and see if there is a tradable precedent in the prior data. Let’s see if we can find one, using historical charts and graphs.
After the close on Thursday, a Wall Street Journal reporter tweeted a table showing the 10 best weekly percentage changes for the S&P 500 (SPX). The table shows that last week’s short trading week was the 8th best for SPX:

I decided to look at trading patterns from the relevant time periods using Bloomberg charts. (There is a historical note to keep in mind: prior to March 1957, when the Standard & Poor’s Index was expanded to 500 companies, the index was comprised of only 90.) For starters, there were 5 occurrences in the early 1930s, 3 of which were in the July-August period of 1932:

Source: Bloomberg
It is apparent that the 1931 week was a classic bear market rally – short, sharp, furious and ultimately futile. The index level at the close of that week was not seen again for years. The Great Depression was raging, and helpful measures were not forthcoming. The 1932 period gives inconclusive results. Buyers in the first and second of the 3 up weeks clearly benefitted in the short-term, as there were successive pushes higher in rapid succession. Those who bought in the third of the 3 weeks saw a continued rise over the ensuing weeks but saw a retest of their purchases within a few months. This period encompassed the depths of the Great Depression and the success of Franklin Roosevelt (FDR) in Presidential polling. The 1933 week was extraordinarily unusual, encompassing only 3 days of trading after markets had been closed for the prior 7 sessions. It was an immediate loser, as the first move was down, but buyers were eventually rewarded as the New Deal took hold in the early months of the Roosevelt Presidency.
Source: Bloomberg
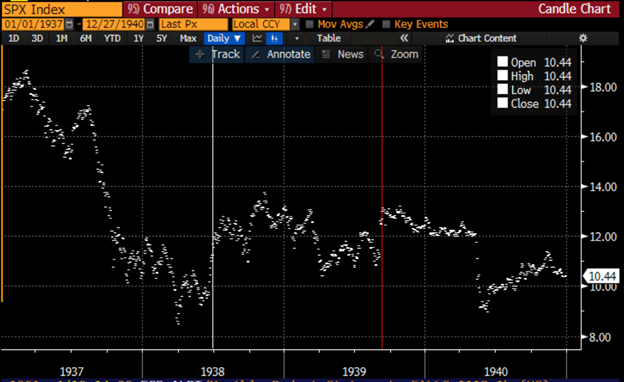
There were 2 occurrences later that decade. By the late 1930s, the worst of the Great Depression was behind the USA, but world markets were beginning to reckon with the militarist advances of Nazi Germany and Japan. The sharp bounce in late 1938 marked the end of a steep decline over the prior year. The immediate result for traders was positive, though SPX spent most of the next year bouncing around the levels reached at the end of that near-record week. Buying at the end of the 1939 weekly jump would have been a mistake under nearly any circumstances, as SPX failed to rally convincingly above that week’s level and traded markedly lower within a year.

Source: Bloomberg
The end of the 1974 week proved to be a wonderful buying opportunity for investors. This week occurred in the wake of President Nixon’s resignation and an Arab oil embargo. The S&P 500 saw a steady and substantial advance throughout the next year and more, rewarding those with a long-term focus, but traders would have had a bumpy ride. The ensuing sessions saw a modest advance, only to see SPX test its lows by year-end. At that point, the rally took root.
Source: Bloomberg
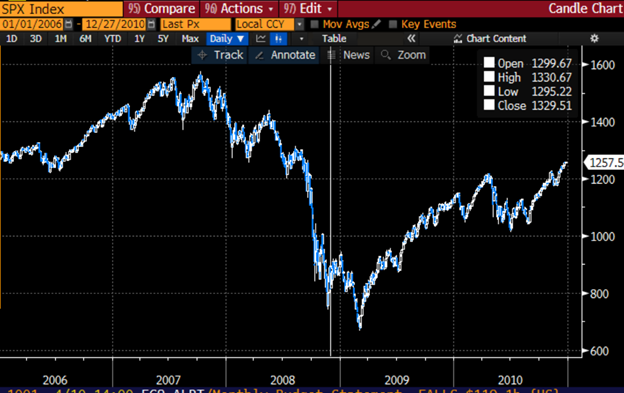
The Great Recession brought us a week in 2008 that was reminiscent of the 1974 period. The market rallied in the wake of Barack Obama’s election as President, though the gains were short-lived. Markets fell about 20% from the level at the end of the 2008 occurrence until they truly bottomed in early 2009. From that point on SPX began a sustained move higher that was in place until only a few weeks ago.
The following table summarizes the results over a few selected periods:

The results show that it was generally profitable for investors and traders alike to buy at the end of the prior 9 best percentage weeks for the S&P 500. However, this is a very small sample size, with highly variable results and 3 of 9 events that largely confirm each other (1932). Like now, all occurred in periods of economic and/or geopolitical volatility. Each of them had their own specific set of circumstances, and uncertainty reigned before markets regained their footing. My conclusion is that while the result appear encouraging for buyers, the tiny sample size and unique market environments make it impossible to make a specific action plan based on prior results.
Disclosure: Interactive Brokers
The analysis in this material is provided for information only and is not and should not be construed as an offer to sell or the solicitation of an offer to buy any security. To the extent that this material discusses general market activity, industry or sector trends or other broad-based economic or political conditions, it should not be construed as research or investment advice. To the extent that it includes references to specific securities, commodities, currencies, or other instruments, those references do not constitute a recommendation by IBKR to buy, sell or hold such investments. This material does not and is not intended to take into account the particular financial conditions, investment objectives or requirements of individual customers. Before acting on this material, you should consider whether it is suitable for your particular circumstances and, as necessary, seek professional advice.
The views and opinions expressed herein are those of the author and do not necessarily reflect the views of Interactive Brokers, its affiliates, or its employees.


![[Gamma] Scalping Please](https://ibkrcampus.com/wp-content/smush-webp/2024/04/tir-featured-8-300x169.jpg.webp "[Gamma] Scalping Please")