


There are many market participants who have come to view the so-called FAANG stocks as paragons of safety in a turbulent environment. Considering that these stocks outperformed the broader indices during both the market’s recent decline and advance, that notion is not without foundation.
After that performance, one might expect to see a steady chart pattern. A long-term chart belies that assumption.
For starters, the FAANG definition needs to be expanded somewhat. At a minimum it needs to include Microsoft (MSFT) alongside Facebook (FB), Apple (AAPL), Amazon (AMZN), Netflix (NFLX), and Alphabet (GOOG, GOOGL). Since those 6 companies (7 stocks) comprise just under 50% of the market capitalization of the NASDAQ 100 Index (NDX), we can effectively use that index as a proxy. That makes NDX convenient because the index has a 35 year history that encompasses many market cycles, and a wide range of financial instruments linked to it.
Consider the following chart:
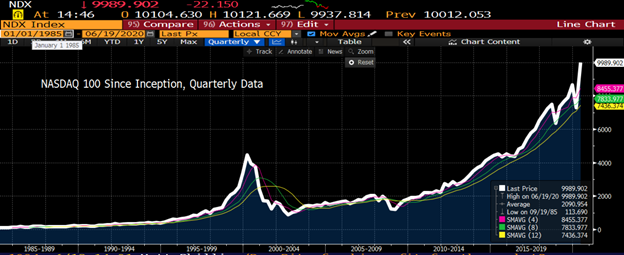
Source: Bloomberg
You may notice that the index and its moving averages have gone parabolic. To a certain extent, that could be expected. Some of the NDX leaders are indeed growing their earnings at an exceptional rate, and that could justify rapidly increasing valuations. Yet the pace of the index’s ascent is on a par with the 1998-2000 period. That period came to be known as the “internet bubble.”
To be sure, there is now much more earnings power behind the leading companies of now versus then. But individual stocks and markets as a whole have a very difficult time sustaining parabolic growth rates. NDX did not fully recoup its 1999 era prices until well over a decade has passed. The problem is that when parabolic price gains can no longer be sustained, the result can be very painful. When markets rise at a linear rate, a reversion to the mean can be relatively modest. When markets rise at a parabolic rate, a reversion to the mean can be quite substantial. The magenta line is the 4 quarter moving average, effectively 1 year. We can see NDX riding that index for most of its existence. But that moving average is now 18% below the current level. A basic mean reversion would have us flirting with a bear market! The yellow line is the 12 quarter moving average. Throughout the current decade that has provided substantial support. Do we really want to see NDX test a support level that is 34% lower?
Let’s be straightforward about a few things. Although markets with parabolic moves and increasingly narrow leadership tend to end poorly, that result is not preordained. First, there is nothing that says that NDX can’t keep up its current rate of growth. Second, there is nothing that requires a stock or a market to revert to a mean. Even if it does revert, the index can do so by moving sideways or up gently long enough for the moving averages to catch up. Third, we are talking about huge amounts of money here – literally trillions of dollars in market capitalization.
There are many reasons for investors to consider holding the FAANG stocks and their brethren. But history shows that safety is not likely to be one of them.
Disclosure: Interactive Brokers
The analysis in this material is provided for information only and is not and should not be construed as an offer to sell or the solicitation of an offer to buy any security. To the extent that this material discusses general market activity, industry or sector trends or other broad-based economic or political conditions, it should not be construed as research or investment advice. To the extent that it includes references to specific securities, commodities, currencies, or other instruments, those references do not constitute a recommendation by IBKR to buy, sell or hold such investments. This material does not and is not intended to take into account the particular financial conditions, investment objectives or requirements of individual customers. Before acting on this material, you should consider whether it is suitable for your particular circumstances and, as necessary, seek professional advice.
The views and opinions expressed herein are those of the author and do not necessarily reflect the views of Interactive Brokers, its affiliates, or its employees.

