


![[Gamma] Scalping Please](https://ibkrcampus.com/wp-content/smush-webp/2024/04/tir-featured-8-700x394.jpg.webp "[Gamma] Scalping Please")


Many investors regard Microsoft (Nasdaq: MSFT) as “old tech.” That sentiment is understandable, given that it went public in 1986, its products are ubiquitous, and its market cap is currently well over $2 trillion. How much future growth can there be? We believe that Microsoft remains a high-growth company and it is still a tech heavyweight.
Its recent financial results have been staggering: Revenue over the last five years has grown at a compound annual growth rate of 15%, and its earnings have grown at an annual rate in excess of 30%.
All that growth has led to opportunities for dividend growth investors. Since it first began paying a dividend in 2003, Microsoft has steadily paid and now raised its payout for 11 consecutive years. The company paid a total of over $16.5 billion in dividends for the fiscal year ending on June 30, 2021, making it the largest dividend payer globally.
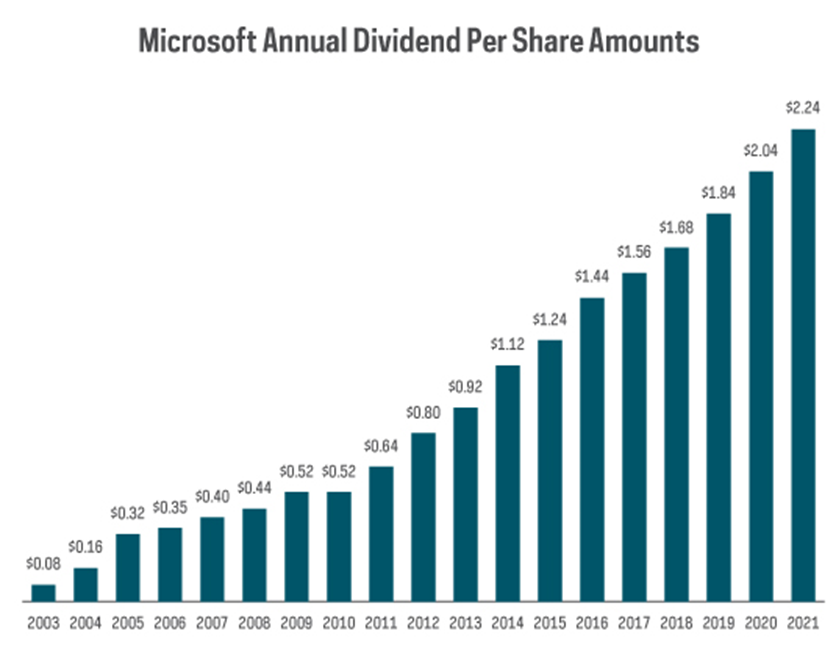
Source: FactSet, for fiscal years ending on June 30. Data from 2003 through 2021.
While its current yield of less than 1% may not sound all that impressive, the almost 20% compound annual growth rate of its dividend certainly has been. Had you purchased a share of MSFT at the end of 2003—when it paid a dividend of $0.08 per share—and held it until September of 2021, your yield on cost today would be over 13%. And that’s in addition to a cumulative price return of over 930%. *
On September 14, 2021, Microsoft announced a quarterly dividend increase to $0.62 per share, representing an increase of over 10% from the prior quarter. And the annual dividend has doubled since 2014. Perhaps the most exciting part of Microsoft’s dividend growth story is that it could just be getting started. The company’s most recent 27.8% dividend payout ratio is low. Microsoft is generating almost $7.50 per share in free cash flow. This cash-flow machine is potentially well positioned to deliver future dividend increases.
Holdings are subject to change.
Data source: FactSet, unless noted otherwise. As of 9/30/21.
* Source: Bloomberg. As of 9/30/21.
—
Originally Posted on November 12, 2021 – Microsoft: A Tech Heavyweight Transforms into a Dividend Growth Machine
Important Information
As of 11/10/21, TDV holdings included 2.89% to Microsoft. Subject to change.
Any forward-looking statements herein are based on expectations of ProShares Advisors LLC at this time.
Investing involves risk, including the possible loss of principal. This ProShares ETF is non-diversified and subject to certain risks, including the risk that the fund may not track the performance of the index and that the fund’s market price may fluctuate, which may decrease performance. Please see summary and full prospectuses for a more complete description of risks. There is no guarantee any ProShares ETF will achieve its investment objective.
Investments in smaller companies typically exhibit higher volatility. Small- and mid-cap companies may have limited product lines or resources, may be dependent upon a particular market niche and may have greater fluctuations in price than the stocks of larger companies. Small- and mid-cap companies may lack the financial and personnel resources to handle economic or industry-wide setbacks and, as a result, such setbacks could have a greater effect on small- and mid-cap security prices.
Technology companies may be subject to intense competition, product obsolescence, general economic conditions and government regulation and may have limited product lines, markets, financial resources or personnel.
Carefully consider the investment objectives, risks, charges and expenses of ProShares before investing. This and other information can be found in their summary and full prospectuses. Read them carefully before investing.
The “S&P® Technology Dividend Aristocrats® Index” is a product of S&P Dow Jones Indices LLC and its affiliates and has been licensed for use by ProShares. “S&P®” is a registered trademark of Standard & Poor’s Financial Services LLC (“S&P”) and “Dow Jones®” is a registered trademark of Dow Jones Trademark Holdings LLC (“Dow Jones”) and have been licensed for use by S&P Dow Jones Indices LLC and its affiliates. ProShares have not been passed on by S&P Dow Jones Indices LLC and its affiliates as to their legality or suitability. ProShares based on the S&P Technology Dividend Aristocrats Index are not sponsored, endorsed, sold or promoted by S&P Dow Jones Indices LLC, Dow Jones, S&P or their respective affiliates, and they make no representation regarding the advisability of investing in ProShares. THESE ENTITIES AND THEIR AFFILIATES MAKE NO WARRANTIES AND BEAR NO LIABILITY WITH RESPECT TO PROSHARES. ProShares are distributed by SEI Investments Distribution Co., which is not affiliated with the fund’s advisor.
Disclosure: ProShares
Any forward-looking statements herein are based on expectations of ProShare Advisors LLC at the time. Whether or not actual results and developments will conform to ProShare Advisors LLC’s expectations and predictions, however, is subject to a number of risks and uncertainties, including general economic, market and business conditions; changes in laws or regulations or other actions made by governmental authorities or regulatory bodies; and other world economic and political developments. ProShare Advisors LLC undertakes no duty to update or revise any forward-looking statements, whether as a result of new information, future events or otherwise.
Investing involves risk, including the possible loss of principal. This information is not meant to be investment advice.
Disclosure: Interactive Brokers
Information posted on IBKR Campus that is provided by third-parties does NOT constitute a recommendation that you should contract for the services of that third party. Third-party participants who contribute to IBKR Campus are independent of Interactive Brokers and Interactive Brokers does not make any representations or warranties concerning the services offered, their past or future performance, or the accuracy of the information provided by the third party. Past performance is no guarantee of future results.
This material is from ProShares and is being posted with its permission. The views expressed in this material are solely those of the author and/or ProShares and Interactive Brokers is not endorsing or recommending any investment or trading discussed in the material. This material is not and should not be construed as an offer to buy or sell any security. It should not be construed as research or investment advice or a recommendation to buy, sell or hold any security or commodity. This material does not and is not intended to take into account the particular financial conditions, investment objectives or requirements of individual customers. Before acting on this material, you should consider whether it is suitable for your particular circumstances and, as necessary, seek professional advice.


