


![[Gamma] Scalping Please](https://ibkrcampus.com/wp-content/smush-webp/2024/04/tir-featured-8-700x394.jpg.webp "[Gamma] Scalping Please")


By: Mark Barnes, PhD, and Christine Haggerty
Few sectors escaped this year’s global equity selloff in Q3, but those most vulnerable to the punishing effects of the recent spike in interest rates have paid an especially heavy toll.
As we cover in the latest GIR Performance Insights report, real estate, telecom, utilities and tech were the worst performers in most markets in Q3 (highlighted below in shades of red). This was particularly the case in the US, UK and Europe, where bond yields have risen the most rapidly as their central banks have embarked on their unwavering rate-hiking regimes.
Regional benchmark and industry returns (TR, LC %) – Three months ended September 30, 2022
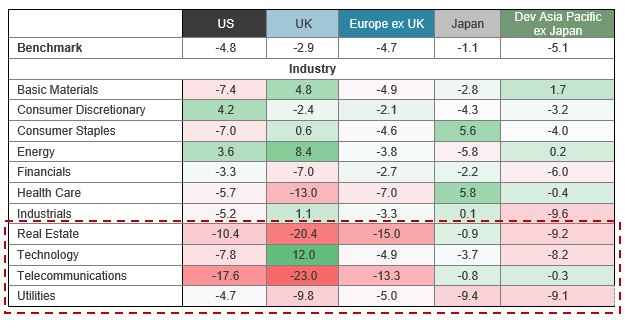
Source: FTSE Russell. Data as of September 30, 2022. Equity markets data based on: FTSE USA, FTSE UK, FTSE Europe ex UK, FTSE Japan and FTSE Developed Asia Pacific ex Japan Indexes and Industry Classification Benchmark (ICB®) industry groups. Past performance is no guarantee to future results. Please see the end for important disclosures.
While all stocks are sensitive to some degree to shifts in monetary policies and their impact on borrowing costs and economic activity, some are especially vulnerable to the kinds of big upward surges seen this year. These include utilities, REITs and telecommunications, which are typically viewed as “bond substitutes” because they often pay high dividends and are favored for the income they provide investors. Rising bond yields diminish the relative appeal of these income-generating stocks.
Other stocks are sensitive to rising rates because of their business models. Obvious examples are companies engaged in real estate, such as homebuilders and mortgage finance companies, which get pummeled by the double whammy of a slowing economy (i.e., weakening demand) and higher mortgage rates. Any business that relies on prospective buyers getting loans – e.g., automakers and car dealerships – suffer from higher lending rates.
Tech stocks and other groups that trade at high relative valuations have joined this club of late because rising rates erode the present value (and thus the attractiveness) of their future earnings. The upswing in US bond yields has also helped fuel the epic rally in the US dollar this year, creating another major headwind for tech companies, which generate a substantial share of their revenue from outside the US.
But it’s all relative
With the exception of technology, these rate-sensitive industries typically comprise only a tiny share of each index. For example, exposures to real estate stocks range from 1.2% of the FTSE Europe ex UK to nearly 8% of the FTSE Developed Asia Pacific ex Japan index. Thus, while a major drag in combination, when viewed individually, their effect on overall benchmark performance in Q3 was a relative non-event.
Industry weights (% of index) – as of September 30, 2022
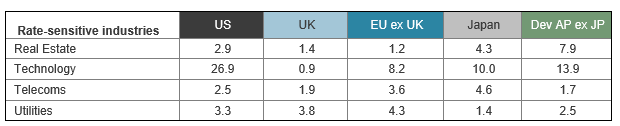
Source: FTSE Russell. Data as of September 30, 2022. Equity markets data based on: FTSE USA, FTSE UK, FTSE Europe ex UK, FTSE Japan and FTSE Developed Asia Pacific ex Japan Indexes and Industry Classification Benchmark (ICB®) industry groups. Past performance is no guarantee of future results. Please see the end for important legal disclosures.
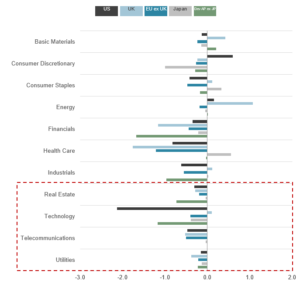
This point becomes even more apparent when examining the industry-weighted contributions to market returns below. All four rate-sensitive industries (except for UK tech) contributed to market losses in Q3. However, for real estate, telecom and utilities, the individual impact paled in comparison to those of industries that make up a bigger portion of each market – e.g., financials and health care in most markets and technology in the US and Asia Pacific.
Industry-weighted contributions to returns (TR, LC %) – Three months ended September 30, 2022

Source: FTSE Russell. Data as of September 30, 2022. Equity markets data based on: FTSE USA, FTSE UK, FTSE Europe ex UK, FTSE Japan and FTSE Developed Asia Pacific ex Japan Indexes and Industry Classification Benchmark (ICB®) industry groups. Past performance is no guarantee of future results. Please see the end for important legal disclosures.
—
Originally Posted October 6, 2022 – Rate-sensitive stocks: a global Q3 casualty
Disclosure: FTSE Russell
Interactive Advisors, a division of Interactive Brokers Group, offers FTSE Russell Index Tracker portfolios on its online investing marketplace. Learn more about the Diversified Portfolios.
This material is not intended as investment advice. Interactive Advisors or portfolio managers on its marketplace may hold long or short positions in the companies mentioned through stocks, options or other securities.
© 2023 London Stock Exchange Group plc and its applicable group undertakings (the “LSE Group”). The LSE Group includes (1) FTSE International Limited (“FTSE”), (2) Frank Russell Company (“Russell”), (3) FTSE Global Debt Capital Markets Inc. and FTSE Global Debt Capital Markets Limited (together, “FTSE Canada”), (4) MTSNext Limited (“MTSNext”), (5) Mergent, Inc. (“Mergent”), (6) FTSE Fixed Income LLC (“FTSE FI”), (7) The Yield Book Inc (“YB”) and (8) Beyond Ratings S.A.S. (“BR”). All rights reserved.
FTSE Russell® is a trading name of FTSE, Russell, FTSE Canada, MTSNext, Mergent, FTSE FI, YB and BR. “FTSE®”, “Russell®”, “FTSE Russell®”, “MTS®”, “FTSE4Good®”, “ICB®”, “Mergent®”, “The Yield Book®”, “Beyond Ratings®“ and all other trademarks and service marks used herein (whether registered or unregistered) are trademarks and/or service marks owned or licensed by the applicable member of the LSE Group or their respective licensors and are owned, or used under licence, by FTSE, Russell, MTSNext, FTSE Canada, Mergent, FTSE FI, YB or BR. FTSE International Limited is authorised and regulated by the Financial Conduct Authority as a benchmark administrator.
All information is provided for information purposes only. All information and data contained in this publication is obtained by the LSE Group, from sources believed by it to be accurate and reliable. Because of the possibility of human and mechanical error as well as other factors, however, such information and data is provided “as is” without warranty of any kind. No member of the LSE Group nor their respective directors, officers, employees, partners or licensors make any claim, prediction, warranty or representation whatsoever, expressly or impliedly, either as to the accuracy, timeliness, completeness, merchantability of any information or of results to be obtained from the use of the FTSE Russell products, including but not limited to indexes, data and analytics or the fitness or suitability of the FTSE Russell products for any particular purpose to which they might be put. Any representation of historical data accessible through FTSE Russell products is provided for information purposes only and is not a reliable indicator of future performance.
No responsibility or liability can be accepted by any member of the LSE Group nor their respective directors, officers, employees, partners or licensors for (a) any loss or damage in whole or in part caused by, resulting from, or relating to any error (negligent or otherwise) or other circumstance involved in procuring, collecting, compiling, interpreting, analysing, editing, transcribing, transmitting, communicating or delivering any such information or data or from use of this document or links to this document or (b) any direct, indirect, special, consequential or incidental damages whatsoever, even if any member of the LSE Group is advised in advance of the possibility of such damages, resulting from the use of, or inability to use, such information.
No member of the LSE Group nor their respective directors, officers, employees, partners or licensors provide investment advice and nothing contained herein or accessible through FTSE Russell products, including statistical data and industry reports, should be taken as constituting financial or investment advice or a financial promotion.
Past performance is no guarantee of future results. Charts and graphs are provided for illustrative purposes only. Index returns shown may not represent the results of the actual trading of investable assets. Certain returns shown may reflect back-tested performance. All performance presented prior to the index inception date is back-tested performance. Back-tested performance is not actual performance, but is hypothetical. The back-test calculations are based on the same methodology that was in effect when the index was officially launched. However, back- tested data may reflect the application of the index methodology with the benefit of hindsight, and the historic calculations of an index may change from month to month based on revisions to the underlying economic data used in the calculation of the index.
This document may contain forward-looking assessments. These are based upon a number of assumptions concerning future conditions that ultimately may prove to be inaccurate. Such forward-looking assessments are subject to risks and uncertainties and may be affected by various factors that may cause actual results to differ materially. No member of the LSE Group nor their licensors assume any duty to and do not undertake to update forward-looking assessments.
No part of this information may be reproduced, stored in a retrieval system or transmitted in any form or by any means, electronic, mechanical, photocopying, recording or otherwise, without prior written permission of the applicable member of the LSE Group. Use and distribution of the LSE Group data requires a licence from FTSE, Russell, FTSE Canada, MTSNext, Mergent, FTSE FI, YB, BR and/or their respective licensors.
Disclosure: Interactive Brokers
Information posted on IBKR Campus that is provided by third-parties does NOT constitute a recommendation that you should contract for the services of that third party. Third-party participants who contribute to IBKR Campus are independent of Interactive Brokers and Interactive Brokers does not make any representations or warranties concerning the services offered, their past or future performance, or the accuracy of the information provided by the third party. Past performance is no guarantee of future results.
This material is from FTSE Russell and is being posted with its permission. The views expressed in this material are solely those of the author and/or FTSE Russell and Interactive Brokers is not endorsing or recommending any investment or trading discussed in the material. This material is not and should not be construed as an offer to buy or sell any security. It should not be construed as research or investment advice or a recommendation to buy, sell or hold any security or commodity. This material does not and is not intended to take into account the particular financial conditions, investment objectives or requirements of individual customers. Before acting on this material, you should consider whether it is suitable for your particular circumstances and, as necessary, seek professional advice.


