


![[Gamma] Scalping Please](https://ibkrcampus.com/wp-content/smush-webp/2024/04/tir-featured-8-700x394.jpg.webp "[Gamma] Scalping Please")


Apropos of little, I had no idea that the term “Taco Tuesday” was trademarked until we learned yesterday that Taco Bell, a division of Yum Brands (YUM) filed a petition with the U.S. Patent and Trademark Office (USPTO) to cancel Taco John’s ownership of the term in 49 states. I bring this up because I like a good alliterative phrase as much as the next guy, if not more. That being the case, I propose the term “Widening Wednesday” to describe the ongoing divergences that we are seeing in various key sectors of the financial markets.
It is hardly a secret that leadership in the US equity market is becoming increasingly narrow. In early April, we warned how the top-heavy nature of the S&P 500 (SPX) and NASDAQ 100 (NDX) raised the stakes for the upcoming earnings season. Fortunately, there no catastrophes among the most mega of the mega cap tech stocks, while reports from Microsoft (MSFT) and Meta Platforms (META) were solidly positive. That allowed NDX to push even higher, even if SPX continued to largely tread water.
Weird fact: SPX closed yesterday at 4,109.90. It closed March 31st at 4,109.31. How’s that for an unchanged quarter-to-date?!?
Yet as NDX rallied and SPX meandered, the divergences became even more pronounced. It was a key discussion point in a podcast that hosted me yesterday, and during media appearances in both the US and abroad this week. It’s one thing to talk about the topic, another to demonstrate it with graphs and statistics. Let’s consider the following…
One way to demonstrate how the largest companies by market capitalization are performing best is to compare the market cap-weighted SPX with its equal-weighted counterpart. The simplest way to do that is to graph SPY, the SPDR S&P 500 ETF Trust, against RSP, the Invesco S&P 500 Equal Weight ETF. Here is what the two ETFs have done over the past two years:
2-Years, SPY (red/green daily bars) vs. RSP (blue line)
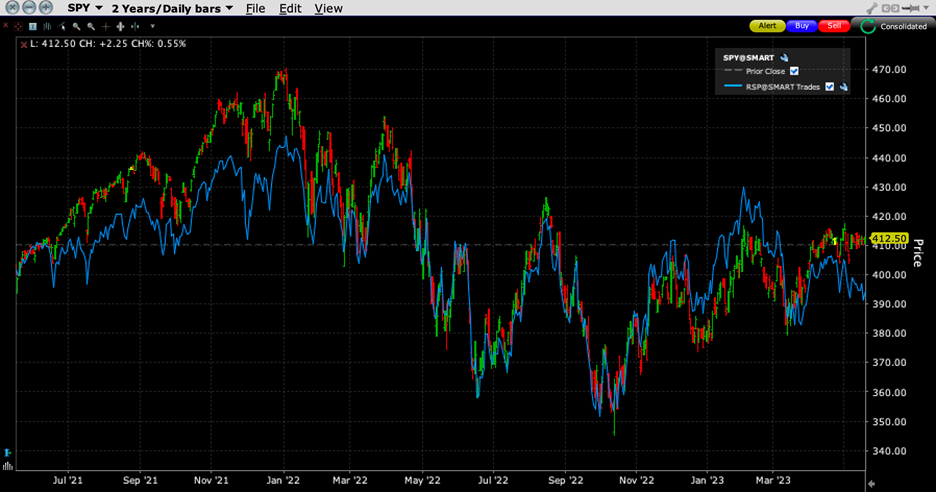
Source: Interactive Brokers
Note that the two ETFs have generally moved in the same direction, if not the same magnitude, over the pictured period – except for the past couple of months. A shorter-term graph makes that more obvious:
5-Months, SPY (red/green daily bars) vs. RSP (blue line)
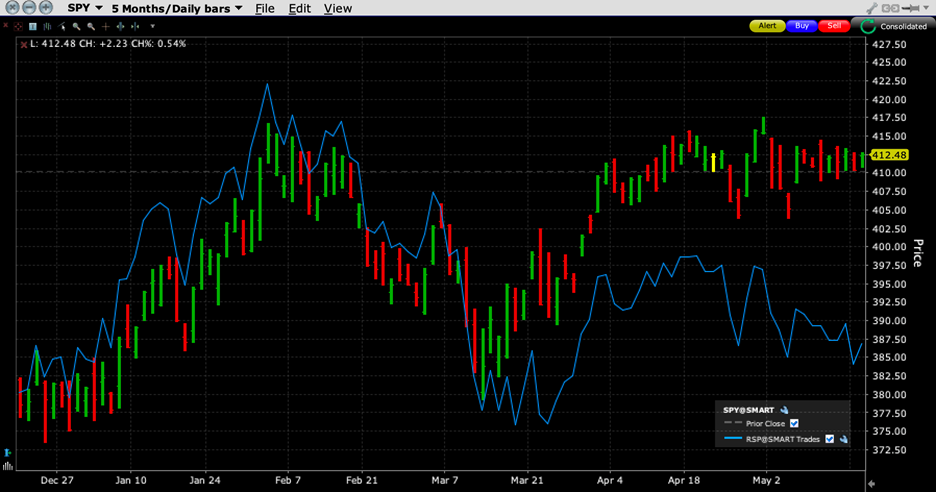
Source: Interactive Brokers
It is obvious that since March, SPY has outperformed RSP. That in itself is not especially worrisome if they are moving in the same direction. But over the past month, RSP sank as SPY has moved sideways. One month is not a meaningfully long time frame, but that is hardly a positive divergence.
We see something similar when we compare SPX to the cumulative NYSE advance-decline line. The two moved together until the past two weeks:
1-Year, SPX (white), NYSE Cumulative Advances-Declines (magenta)
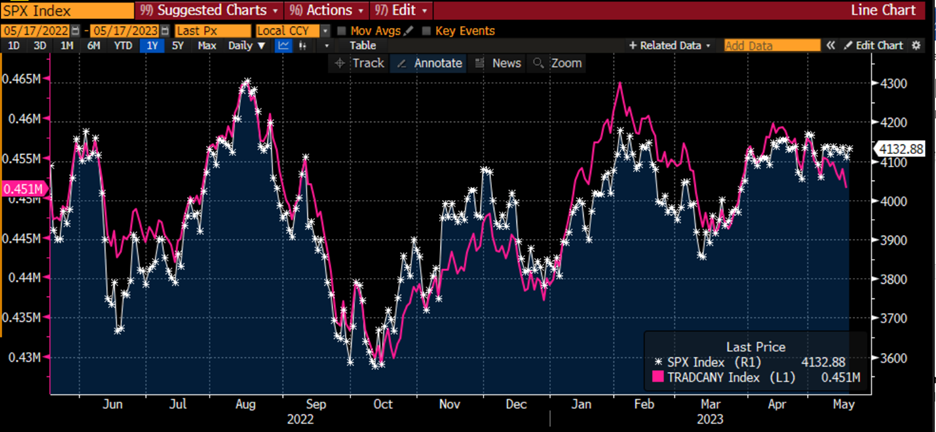
Source: Bloomberg
None of this should be all that concerning. It’s a yellow flag at best. But since the mega cap tech stocks are all NASDAQ-listed, the NYSE is not the best forum for comparison. Unfortunately, that picture is much more concerning:
2-Years, NDX (white), NASDAQ Cumulative Advances-Declines (magenta)
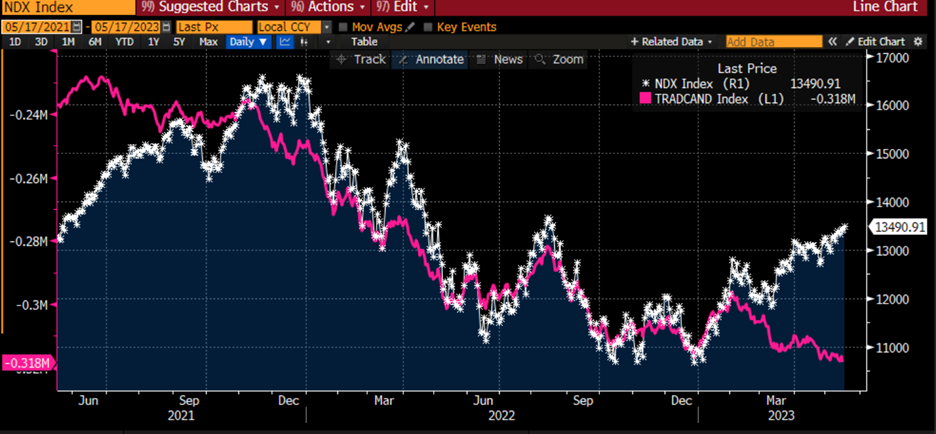
Source: Bloomberg
The divergence since the start of February is quite pronounced. We see NDX continuing higher while the NASDAQ advance-decline line sinks. That is a testament to the lack of participation by the majority of stocks listed on that exchange.
The reason we extended the time period for this graph is that the late 2021 period is informative. We saw a similar situation, with the A/D line falling as NDX rose from July-September. After a quick selloff, we saw a modest rise in A/D that failed to confirm the eventual NDX top in November. From November to January, we saw NDX move sideways even as the A/D line sank. We then know what transpired in 2022.
One more NASDAQ divergence stands out. NDX is now at an all-time high relative to the broad-based NASDAQ Composite Index (CCMP). The following graph looks back over the past 25 years. For most of that history, the relationship was quite stable, except for a period of NDX outperformance during the declines in 2000.
25-Years Monthly, NDX (white, top), CCMP (orange, top); NDX-CCMP Spread (bottom)
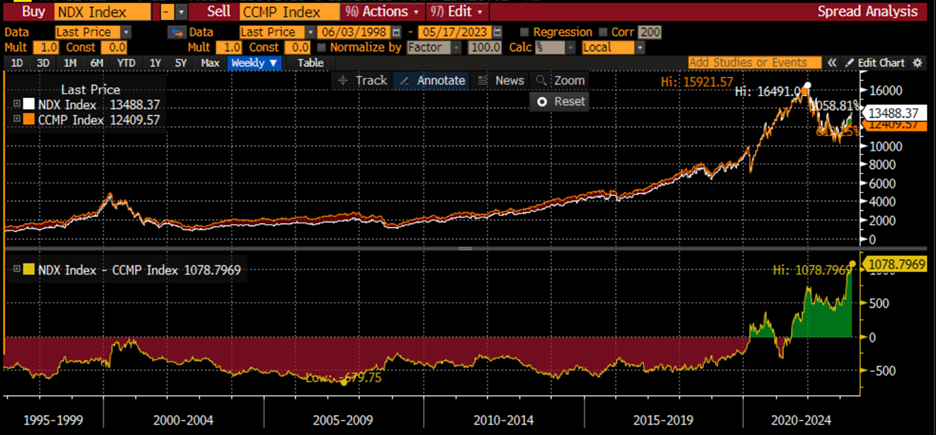
Source: Bloomberg
In 2020, the post-Covid recovery was led by the largest tech stocks, many of which were the most popular with newly emboldened and enriched individual investors, though the laggards had largely caught up by early 2021. Since late 2021, however, the outperformance of NDX has become ever-more pronounced – and never more than in the past few months.
3-Years Daily, NDX (white, top), CCMP (orange, top); NDX-CCMP Spread (bottom)
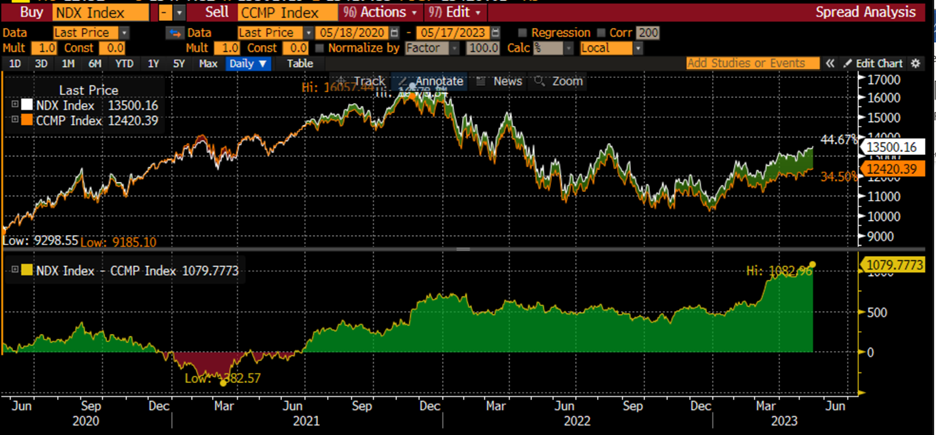
Source: Bloomberg
As concerning as these graphs may be, the news isn’t necessarily bad. It is entirely possible that the broader measures could play catch up, as they did in late 2021. Of course, that occurred when massive monetary and fiscal stimuli provided a huge tailwind for equities. Those have now become headwinds, however. The biggest stocks seem best equipped to battle those headwinds. Let’s see how long that can continue.
Disclosure: Interactive Brokers
The analysis in this material is provided for information only and is not and should not be construed as an offer to sell or the solicitation of an offer to buy any security. To the extent that this material discusses general market activity, industry or sector trends or other broad-based economic or political conditions, it should not be construed as research or investment advice. To the extent that it includes references to specific securities, commodities, currencies, or other instruments, those references do not constitute a recommendation by IBKR to buy, sell or hold such investments. This material does not and is not intended to take into account the particular financial conditions, investment objectives or requirements of individual customers. Before acting on this material, you should consider whether it is suitable for your particular circumstances and, as necessary, seek professional advice.
The views and opinions expressed herein are those of the author and do not necessarily reflect the views of Interactive Brokers, its affiliates, or its employees.
Disclosure: ETFs
Any discussion or mention of an ETF is not to be construed as recommendation, promotion or solicitation. All investors should review and consider associated investment risks, charges and expenses of the investment company or fund prior to investing. Before acting on this material, you should consider whether it is suitable for your particular circumstances and, as necessary, seek professional advice.

Join The Conversation
If you have a general question, it may already be covered in our FAQs. If you have an account-specific question or concern, please reach out to Client Services.