


![[Gamma] Scalping Please](https://ibkrcampus.com/wp-content/smush-webp/2024/04/tir-featured-8-700x394.jpg.webp "[Gamma] Scalping Please")


- The trailing three-month excess return on non-US versus US stocks is in the 90th percentile dating back to 1971
- The strong return momentum for non-US stocks is supported by better relative earnings momentum
- Despite the strong returns, valuations for non-US continue to be far more attractive than in US markets
Developed non-US equities have finally ended US stocks’ record run of dominance. Up until December of last year, US firms had outperformed non-US developed stocks for four consecutive calendar years and in 55 consecutive rolling 12-month periods.1
Over those 55 periods, the US cumulatively outperformed non-US by 57%.2 And because US stocks were the leading exposure over developed ex-US and emerging markets (EM), globally diversified portfolios lagged those built with more of a home bias.
That’s changed. Non-US stocks outperformed the US by 6.7% in December and almost 2% in January. With momentum, sentiment, and valuations as catalysts, non-US stocks likely will hang onto their leadership position for a few more periods.
Momentum Strengthening Outside the US
Short-term return trends have strengthened significantly for non-US stocks. Over the past three months, non-US has beaten US by 7.5%, this ranks in the 90th percentile back to 1971.3
In fact, the rolling three-month excess return figure has been positive for 70 consecutive days — the longest stretch of continuous outperformance since 2017 when non-US stocks went on an 81-day run. The difference is that today’s average excess return has been much larger (+9.9%, compared to just 2.2%).4
Our Chart Pack regional momentum scorecard shows academically constructed short-, intermediate-, and-long-term-momentum indicators also favor non-US over US. See the table below.
In all periods, (three-, six-, and 12-month momentum), international developed (MSCI EAFE) has better figures than the US. European markets have the strongest figures on a three- and six- month basis. As European strength pushes broader non-US markets momentum, it’s notable that more than one country/segment is driving returns.
Non-US Markets Rank High on Multiple Momentum Metrics
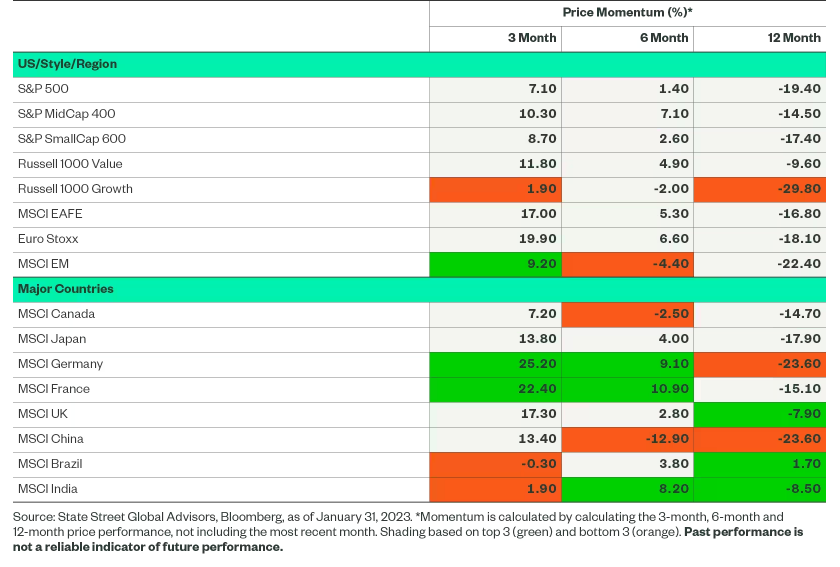
Looking at continuous momentum (or frog-in-the-pan momentum) that measures the number of days with positive returns over a lookback period, non-US markets once again have stronger figures than the US (51 to 38 over a 90-day lookback and 86 to 80 for a 180-day lookback).5
For momentum investors, the signal for developed non-US markets has turned green.
Earnings Sentiment Stronger Outside the US, Relatively Speaking
Recent earnings sentiment trends between the two regions provide a simple rationale for stronger price returns for non-US stocks versus the US markets.
Over the past six months, all major regions have witnessed downside revisions to 2023 earnings-per-share (EPS) estimates, led by EM, which had its growth revised down from a positive 6% to a negative 4% (reason enough to be cautious on EM’s short-term momentum trends).6
But non-US stocks have seen the shallowest declines, falling from 3.8% to 1.4%, as the US fell from 7.8% to 2.39%.7 And while the US’s 2.39% ranks as the highest projected growth rate among the three major areas, it has fallen monotonically every month in the past three- and six-month periods.
Conversely, 2023 EPS figures for non-US developed stocks have improved every month over the past three months. Not surprisingly, given the strong momentum trends, European markets have witnessed greater upward earnings revisions as well.
While there are still more downgrades than upgrades (ratio less than one), non-US developed stocks up-to-down ratio is the strongest among all major regions, supported by strong trends in Europe and Japan.
2023 Earnings Growth Revised Upward for Non-US Stocks in Past 3 Months

What’s driving stronger relative earnings momentum outside the US? A simplistic rationale is that lower gas prices have eased stagflation worries in Europe, while improving aggregate demand. Additionally, China’s re-opening has boosted growth optimism for regions close to China. This divergence is visible in economic releases as well, as Citi Eurozone and Global Economic Surprise Indices have turned positive, while the US’s figure is negative.8
Add earnings sentiment to momentum as a tailwind for non-US developed stocks.
Click here to read the full article
Footnotes
1Based on the performance of the MSCI EAFE Index and the S&P 500 Index between April 2018 and November 2022 per Bloomberg Finance L.P.
2Based on the performance of the MSCI EAFE Index and the S&P 500 Index between April 2018 and November 2022 per Bloomberg Finance L.P.
3Based on the performance of the MSCI EAFE Index per Bloomberg Finance L.P.
4Based on the performance of the MSCI EAFE Index per Bloomberg Finance L.P.
5Based on the performance of the MSCI EAFE Index and the S&P 500 Index per Bloomberg Finance L.P.
6Based on consensus analyst estimates for the MSCI EAFE Index, S&P 500 Index, and MSCI Emerging Markets Index per FactSet.
7Based on consensus analyst estimates for the MSCI EAFE Index, S&P 500 Index, and MSCI Emerging Markets Index per FactSet.
8Based on Citi Economic Surprise Indices per Bloomberg Finance L.P.
Glossary
MSCI ACWI Index
Market-capitalization-weighted stock market index that measures the stock performance of the companies in developed and emerging markets.
MSCI EAFE Index
Market-capitalization-weighted stock market index that measures the stock performance of the companies in developed markets – excluding the US and Canada.
MSCI Emerging Market Index
Market-capitalization-weighted stock market index that measures the stock performance of the companies in emerging markets.
S&P 500 Index
The S&P 500® is widely regarded as the best single gauge of large-cap U.S. equities and serves as the foundation for a wide range of investment products. The index includes 500 leading companies and captures approximately 80% coverage of available market capitalization.
—
Originally Posted February 13, 2023 – The Case for International Equities in 3 Charts
Disclosure
The views expressed in this material are the views of the SPDR Research and Strategy team through the period ended February 8, 2023, and are subject to change based on market and other conditions. This document contains certain statements that may be deemed forward-looking statements. Please note that any such statements are not guarantees of any future performance and actual results or developments may differ materially from those projected.
The information provided does not constitute investment advice and it should not be relied on as such. It should not be considered a solicitation to buy or an offer to sell a security. It does not take into account any investor’s particular investment objectives, strategies, tax status or investment horizon. You should consult your tax and financial advisor.
Unless otherwise noted, all data and statistical information were obtained from Bloomberg Finance, L.P. and SSGA as of February 8, 2023. Data in tables have been rounded to whole numbers, except for percentages, which have been rounded to the nearest tenth of a percent.
All information is from SSGA unless otherwise noted and has been obtained from sources believed to be reliable, but its accuracy is not guaranteed. There is no representation or warranty as to the current accuracy, reliability or completeness of, nor liability for, decisions based on such information and it should not be relied on as such.
Investing involves risk including the risk of loss of principal.
Equity securities may fluctuate in value and can decline significantly in response to the activities of individual companies and general market and economic conditions.
Because of their narrow focus, sector investing tends to be more volatile than investments that diversify across many sectors and companies.
The whole or any part of this work may not be reproduced, copied or transmitted or any of its contents disclosed to third parties without SSGA’s express written consent.
Disclosure: State Street Global Advisors
Do not reproduce or reprint without the written permission of SSGA.
All information has been obtained from sources believed to be reliable, but its accuracy is not guaranteed. There is no representation or warranty as to the current accuracy, reliability or completeness of, nor liability for, decisions based on such information and it should not be relied on as such.
State Street Global Advisors and its affiliates (“SSGA”) have not taken into consideration the circumstances of any particular investor in producing this material and are not making an investment recommendation or acting in fiduciary capacity in connection with the provision of the information contained herein.
ETFs trade like stocks, are subject to investment risk, fluctuate in market value and may trade at prices above or below the ETF’s net asset value. Brokerage commissions and ETF expenses will reduce returns.
Bonds generally present less short-term risk and volatility than stocks, but contain interest rate risk (as interest rates raise, bond prices usually fall); issuer default risk; issuer credit risk; liquidity risk; and inflation risk. These effects are usually pronounced for longer-term securities. Any fixed income security sold or redeemed prior to maturity may be subject to a substantial gain or loss.
Investing involves risk including the risk of loss of principal.
The whole or any part of this work may not be reproduced, copied or transmitted or any of its contents disclosed to third parties without SSGA’s express written consent.
Investing in high yield fixed income securities, otherwise known as “junk bonds”, is considered speculative and involves greater risk of loss of principal and interest than investing in investment grade fixed income securities. These Lower-quality debt securities involve greater risk of default or price changes due to potential changes in the credit quality of the issuer.
COPYRIGHT AND OTHER RIGHTS
Other third party content is the intellectual property of the respective third party and all rights are reserved to them. All rights reserved. No organization or individual is permitted to reproduce, distribute or otherwise use the statistics and information in this report without the written agreement of the copyright owners.
Definition:
Arbitrage: the simultaneous buying and selling of securities, currency, or commodities in different markets or in derivative forms in order to take advantage of differing prices for the same asset.
Fund Objectives:
SPY: The investment seeks to provide investment results that, before expenses, correspond generally to the price and yield performance of the S&P 500® Index. The Trust seeks to achieve its investment objective by holding a portfolio of the common stocks that are included in the index (the “Portfolio”), with the weight of each stock in the Portfolio substantially corresponding to the weight of such stock in the index.
VOO: The investment seeks to track the performance of a benchmark index that measures the investment return of large-capitalization stocks. The fund employs an indexing investment approach designed to track the performance of the Standard & Poor’s 500 Index, a widely recognized benchmark of U.S. stock market performance that is dominated by the stocks of large U.S. companies. The advisor attempts to replicate the target index by investing all, or substantially all, of its assets in the stocks that make up the index, holding each stock in approximately the same proportion as its weighting in the index.
IVV: The investment seeks to track the investment results of the S&P 500 (the “underlying index”), which measures the performance of the large-capitalization sector of the U.S. equity market. The fund generally invests at least 90% of its assets in securities of the underlying index and in depositary receipts representing securities of the underlying index. It may invest the remainder of its assets in certain futures, options and swap contracts, cash and cash equivalents, as well as in securities not included in the underlying index, but which the advisor believes will help the fund track the underlying index.
The funds presented herein have different investment objectives, costs and expenses. Each fund is managed by a different investment firm, and the performance of each fund will necessarily depend on the ability of their respective managers to select portfolio investments. These differences, among others, may result in significant disparity in the funds’ portfolio assets and performance. For further information on the funds, please review their respective prospectuses.
Entity Disclosures:
The trademarks and service marks referenced herein are the property of their respective owners. Third party data providers make no warranties or representations of any kind relating to the accuracy, completeness or timeliness of the data and have no liability for damages of any kind relating to the use of such data.
SSGA Funds Management, Inc. serves as the investment advisor to the SPDR ETFs that are registered with the United States Securities and Exchange Commission under the Investment Company Act of 1940. SSGA Funds Management, Inc. is an affiliate of State Street Global Advisors Limited.
Intellectual Property Disclosures:
Standard & Poor’s®, S&P® and SPDR® are registered trademarks of Standard & Poor’s® Financial Services LLC (S&P); Dow Jones is a registered trademark of Dow Jones Trademark Holdings LLC (Dow Jones); and these trademarks have been licensed for use by S&P Dow Jones Indices LLC (SPDJI) and sublicensed for certain purposes by State Street Corporation. State Street Corporation’s financial products are not sponsored, endorsed, sold or promoted by SPDJI, Dow Jones, S&P, their respective affiliates and third party licensors and none of such parties make any representation regarding the advisability of investing in such product(s) nor do they have any liability in relation thereto, including for any errors, omissions, or interruptions of any index.
BLOOMBERG®, a trademark and service mark of Bloomberg Finance, L.P. and its affiliates, and BARCLAYS®, a trademark and service mark of Barclays Bank Plc., have each been licensed for use in connection with the listing and trading of the SPDR Bloomberg Barclays ETFs.
Distributor: State Street Global Advisors Funds Distributors, LLC, member FINRA, SIPC, an indirect wholly owned subsidiary of State Street Corporation. References to State Street may include State Street Corporation and its affiliates. Certain State Street affiliates provide services and receive fees from the SPDR ETFs.
ALPS Distributors, Inc., member FINRA, is distributor for SPDR® S&P 500®, SPDR® S&P MidCap 400® and SPDR® Dow Jones Industrial Average, all unit investment trusts. ALPS Distributors, Inc. is not affiliated with State Street Global Advisors Funds Distributors, LLC.
Before investing, consider the funds’ investment objectives, risks, charges, and expenses. For SPDR funds, you may obtain a prospectus or summary prospectus containing this and other information by calling 1‐866‐787‐2257 or visiting www.spdrs.com. Please read the prospectus carefully before investing.
Disclosure: Interactive Brokers
Information posted on IBKR Campus that is provided by third-parties does NOT constitute a recommendation that you should contract for the services of that third party. Third-party participants who contribute to IBKR Campus are independent of Interactive Brokers and Interactive Brokers does not make any representations or warranties concerning the services offered, their past or future performance, or the accuracy of the information provided by the third party. Past performance is no guarantee of future results.
This material is from State Street Global Advisors and is being posted with its permission. The views expressed in this material are solely those of the author and/or State Street Global Advisors and Interactive Brokers is not endorsing or recommending any investment or trading discussed in the material. This material is not and should not be construed as an offer to buy or sell any security. It should not be construed as research or investment advice or a recommendation to buy, sell or hold any security or commodity. This material does not and is not intended to take into account the particular financial conditions, investment objectives or requirements of individual customers. Before acting on this material, you should consider whether it is suitable for your particular circumstances and, as necessary, seek professional advice.


![[Gamma] Scalping Please](https://ibkrcampus.com/wp-content/smush-webp/2024/04/tir-featured-8-300x169.jpg.webp "[Gamma] Scalping Please")