


![[Gamma] Scalping Please](https://ibkrcampus.com/wp-content/smush-webp/2024/04/tir-featured-8-700x394.jpg.webp "[Gamma] Scalping Please")


The past five years in US markets have been nothing if not eventful. They’ve featured every macro regime of the economic cycle, where markets weathered a global pandemic, quantitative tightening and easing, inflation, and both low and rising rate environments. And while US large cap equity indexes have generally fared well over the past five years, the Russell 1000 Invesco Dynamic Multifactor Index [RB1] has posted standout returns — shedding light on the potential value of tactically allocating to factors throughout economic cycles.
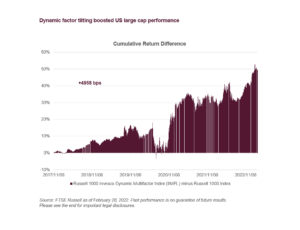
US large caps did well — but factor tilting gave them a boost
The Russell 1000 Index — an unbiased barometer for the broad US large cap segment — has largely shrugged off the ever-shifting macroeconomic backdrop since 2017, returning an annualized 9.7% for the period.[1] However, while this performance is far from weak, the Russell 1000 Invesco Dynamic Multifactor Index returns have almost consistently outstripped those of the Russell 1000 over the past five years, outperforming by a cumulative +4,958 bps.

Growth was the right choice at the right time
One of the noteworthy US market trends over the past five years was growth stocks’ outperformance relative to value from 2019-2021. The Russell 1000 Growth Index represents the constituents of the Russell 1000 that exhibit growth characteristics — effectively measuring the performance of the US large cap growth segment — and the index returned an annualized 11.6% for the five-year period.
Growth’s run of strong relative performance is evident when comparing the Russell 1000 Growth index to the Russell 1000 Invesco Dynamic Multifactor Index. However, despite a stretch of underperformance during the growth rotation, the dynamic multifactor index cumulatively outperformed by +2,713 bps over the past five years.
This chart suggests that while a tactical rotation into growth stocks for the 2019-2021 period would have delivered strong relative performance, allocating dynamically to factors would have resulted in higher relative returns over the longer term.
Why the factor tilt outperformance?
Understanding how factors behave in different market cycles is key to explaining Russell 1000 Invesco Dynamic Multifactor Index outperformance. The past five years have featured every macro regime in the economic cycle — and, as we have explaine before, factors tend to exhibit cyclicality and perform differently in response to each regime.
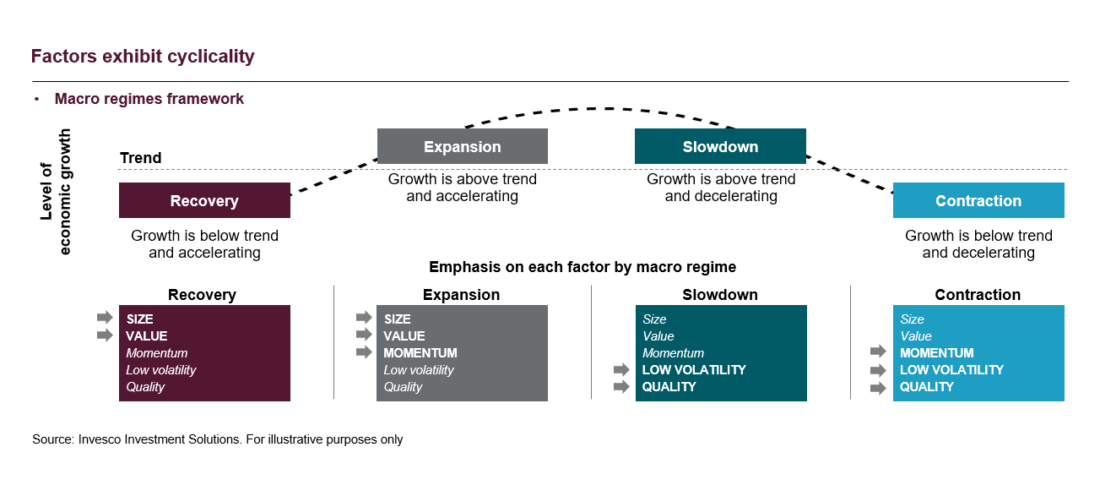
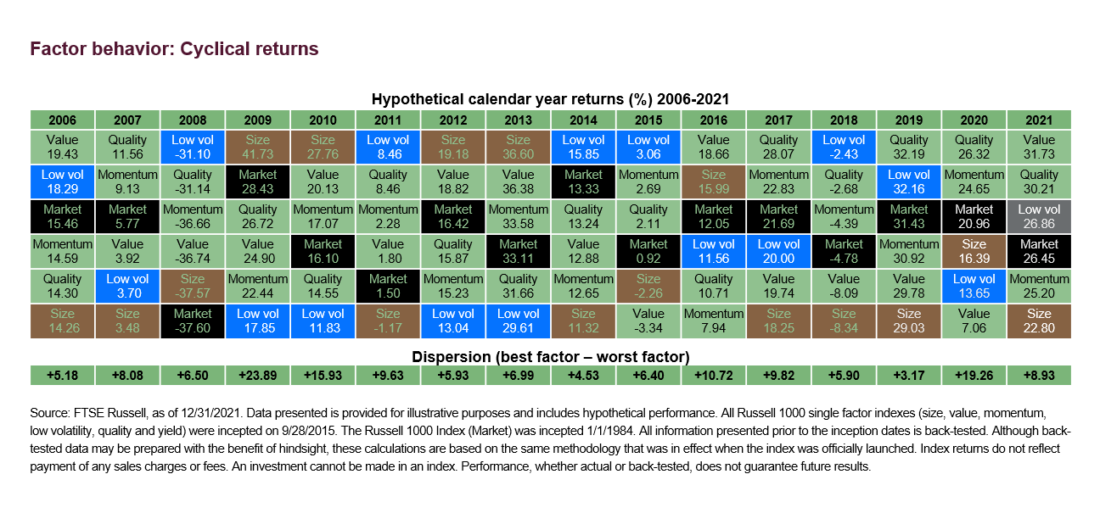
As a result of this cyclicality, no one factor consistently outperforms over every short-term period. A factor that finishes at the top of factor rankings one year might not continue that trend into the next calendar year.
In essence, the Russell 1000 Invesco Dynamic Multifactor Index performance has not only benefited from low correlations among factors, but also from tactically weighting the factors themselves as the US economy has cycled through macro regimes.
An index designed to dynamically capture factor cyclicality
As we outlined recently Some investment strategies don’t survive contact with reality, but the Russell 1000 Invesco Dynamic Multifactor Index has performed true to its design over the past five years. Constructed with a transparent, rules-based approach that dynamically re-weights constituents based on factor scores and economic cycles, the index’s multi-factor tilting framework has been a key driver behind its strong performance.
For more details about multi-factor indexes, see our FTSE Invesco Dynamic MultiFactor Index Series or Subscribe to our blog.
For more information on equity factors, see our equity factors report that’s updated quarterly.
[1] FTSE Russell for the period ending February 28, 2023.
—
Originally Posted March 28, 2023 – Why US large caps have fared better with a factor tilting approach
Disclosure: FTSE Russell
Interactive Advisors, a division of Interactive Brokers Group, offers FTSE Russell Index Tracker portfolios on its online investing marketplace. Learn more about the Diversified Portfolios.
This material is not intended as investment advice. Interactive Advisors or portfolio managers on its marketplace may hold long or short positions in the companies mentioned through stocks, options or other securities.
© 2023 London Stock Exchange Group plc and its applicable group undertakings (the “LSE Group”). The LSE Group includes (1) FTSE International Limited (“FTSE”), (2) Frank Russell Company (“Russell”), (3) FTSE Global Debt Capital Markets Inc. and FTSE Global Debt Capital Markets Limited (together, “FTSE Canada”), (4) MTSNext Limited (“MTSNext”), (5) Mergent, Inc. (“Mergent”), (6) FTSE Fixed Income LLC (“FTSE FI”), (7) The Yield Book Inc (“YB”) and (8) Beyond Ratings S.A.S. (“BR”). All rights reserved.
FTSE Russell® is a trading name of FTSE, Russell, FTSE Canada, MTSNext, Mergent, FTSE FI, YB and BR. “FTSE®”, “Russell®”, “FTSE Russell®”, “MTS®”, “FTSE4Good®”, “ICB®”, “Mergent®”, “The Yield Book®”, “Beyond Ratings®“ and all other trademarks and service marks used herein (whether registered or unregistered) are trademarks and/or service marks owned or licensed by the applicable member of the LSE Group or their respective licensors and are owned, or used under licence, by FTSE, Russell, MTSNext, FTSE Canada, Mergent, FTSE FI, YB or BR. FTSE International Limited is authorised and regulated by the Financial Conduct Authority as a benchmark administrator.
All information is provided for information purposes only. All information and data contained in this publication is obtained by the LSE Group, from sources believed by it to be accurate and reliable. Because of the possibility of human and mechanical error as well as other factors, however, such information and data is provided “as is” without warranty of any kind. No member of the LSE Group nor their respective directors, officers, employees, partners or licensors make any claim, prediction, warranty or representation whatsoever, expressly or impliedly, either as to the accuracy, timeliness, completeness, merchantability of any information or of results to be obtained from the use of the FTSE Russell products, including but not limited to indexes, data and analytics or the fitness or suitability of the FTSE Russell products for any particular purpose to which they might be put. Any representation of historical data accessible through FTSE Russell products is provided for information purposes only and is not a reliable indicator of future performance.
No responsibility or liability can be accepted by any member of the LSE Group nor their respective directors, officers, employees, partners or licensors for (a) any loss or damage in whole or in part caused by, resulting from, or relating to any error (negligent or otherwise) or other circumstance involved in procuring, collecting, compiling, interpreting, analysing, editing, transcribing, transmitting, communicating or delivering any such information or data or from use of this document or links to this document or (b) any direct, indirect, special, consequential or incidental damages whatsoever, even if any member of the LSE Group is advised in advance of the possibility of such damages, resulting from the use of, or inability to use, such information.
No member of the LSE Group nor their respective directors, officers, employees, partners or licensors provide investment advice and nothing contained herein or accessible through FTSE Russell products, including statistical data and industry reports, should be taken as constituting financial or investment advice or a financial promotion.
Past performance is no guarantee of future results. Charts and graphs are provided for illustrative purposes only. Index returns shown may not represent the results of the actual trading of investable assets. Certain returns shown may reflect back-tested performance. All performance presented prior to the index inception date is back-tested performance. Back-tested performance is not actual performance, but is hypothetical. The back-test calculations are based on the same methodology that was in effect when the index was officially launched. However, back- tested data may reflect the application of the index methodology with the benefit of hindsight, and the historic calculations of an index may change from month to month based on revisions to the underlying economic data used in the calculation of the index.
This document may contain forward-looking assessments. These are based upon a number of assumptions concerning future conditions that ultimately may prove to be inaccurate. Such forward-looking assessments are subject to risks and uncertainties and may be affected by various factors that may cause actual results to differ materially. No member of the LSE Group nor their licensors assume any duty to and do not undertake to update forward-looking assessments.
No part of this information may be reproduced, stored in a retrieval system or transmitted in any form or by any means, electronic, mechanical, photocopying, recording or otherwise, without prior written permission of the applicable member of the LSE Group. Use and distribution of the LSE Group data requires a licence from FTSE, Russell, FTSE Canada, MTSNext, Mergent, FTSE FI, YB, BR and/or their respective licensors.
Disclosure: Interactive Brokers
Information posted on IBKR Campus that is provided by third-parties does NOT constitute a recommendation that you should contract for the services of that third party. Third-party participants who contribute to IBKR Campus are independent of Interactive Brokers and Interactive Brokers does not make any representations or warranties concerning the services offered, their past or future performance, or the accuracy of the information provided by the third party. Past performance is no guarantee of future results.
This material is from FTSE Russell and is being posted with its permission. The views expressed in this material are solely those of the author and/or FTSE Russell and Interactive Brokers is not endorsing or recommending any investment or trading discussed in the material. This material is not and should not be construed as an offer to buy or sell any security. It should not be construed as research or investment advice or a recommendation to buy, sell or hold any security or commodity. This material does not and is not intended to take into account the particular financial conditions, investment objectives or requirements of individual customers. Before acting on this material, you should consider whether it is suitable for your particular circumstances and, as necessary, seek professional advice.


