


CMT Association’s Market Insights features timely technical analysis of current global markets by veteran CMT charterholders. Each post appears on www.tradingview.com/u/CMT_Association/ in an effort to explain process, tools, and the responsible practice of technical analysis. Shared content and posted charts are intended to be used for informational and educational purposes only. The CMT Association does not offer, and this information shall not be understood or construed as, financial advice or investment recommendations. The information provided is not a substitute for advice from an investment professional. The CMT Association does not accept liability for any financial loss or damage our audience may incur.
In the frustrating attempts to determine which rallies may represent the end to an overall market decline, one has to recognize, particularly in the throes of a bear market cycle, that “All Advances are Not Equal” even as all stocks may rally together with the market.
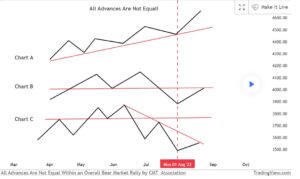
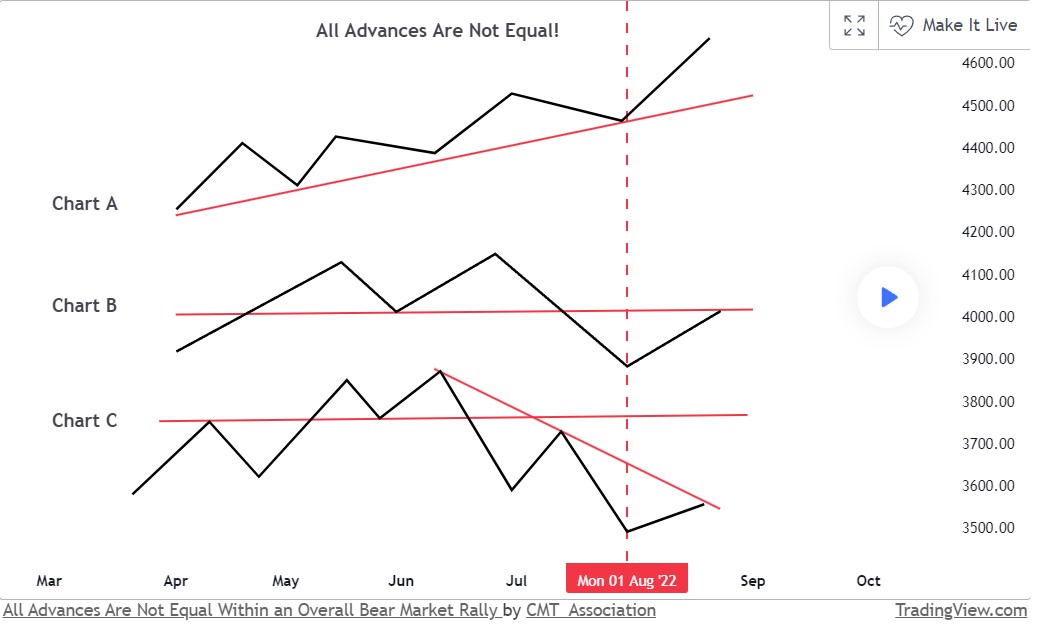
Within any market trend, there will be rally phases. However, rallies may not carry all stocks to new highs, as all advances are not equal. In the schematic, to the right of the vertical line, one can see that each stock is advancing, but each of the three schematic advances represent a very different implication within the structural trend of each individual stock.
Some may represent breakouts to new highs; others may represent only kickback rallies into resistance (formerly support, now broken) offering an opportunity to sell into strength (generally prior to another decline); some are rallies off the lows (toward a lower resistance), that thereafter may fall lower on the next market decline (or at best, begin stabilization / accumulation to contribute to a future sustainable advance).
While all stocks may rally simultaneously, some of the advances may represent rallies in their ongoing structural bull market uptrends which carry examples across sectors.
Other advances represent rallies into the resistance of major topping formations or resistance of secondary declines (Chart type B), offering another opportunity to sell into strength within new or established downtrends.
Still other advances may represent bear market rallies from even more depressed levels within ongoing structural declining trends (chart type C).
The latter two rallies (B and C) would be considered contra-trend rallies, or temporary rallies in the opposite direction to the major trend (in these cases down). In some instances, these kickback rallies can represent substantial percentage advances, depending on the degree of decline to which the stock price may have fallen.

Chart type A represents a bull market advance: If the market indexes were to decline again, we would expect these already uptrending stocks to establish / hold their support levels, move into consolidations, and / or decline overall less than the market (unless support levels were seriously violated on retreats).

Notice, too, that accompanying these advancing price trends, the Monthly Momentum models (lower panels) are positive, on a buy, and rising to new highs with price, confirming the price trend. We have discussed the momentum models in a prior educational piece that is linked below.
Chart type B represents a rally into resistance (formerly support) of the topping formations following an initial price breakdown through support, or a rally into resistance following a secondary support break, offering another opportunity to sell into strength within new, or extending, downtrends.


Notice here, that the Monthly Momentum models are negative, on a Sell, and declining, confirming the declining price trend, with no evidence as yet of reversing.
Chart type C represents rallies in very depressed stocks that could encounter a bounce / sharp generous rally, in a later stage of their structural bear markets, but well before a necessary and generally extensive repair phase is in place. These, often short lived-rallies, can offer another opportunity to sell into strength.


Notice here that the monthly momentum models are mixed: The top one is on a Buy but well below the zero line in negative territory; a consolidation may be initiating, or another decline may develop. The bottom one is on a Sell and declining, suggesting the decline may not yet be over.
Any market weakness (Chart types B and C) may cause the price to roll over again to test or break support levels. These rallies either may not hold, or can initiate a repair phase. We would expect this behavior among those stocks in individual structural bear markets.
Obviously, if all these rallies (Chart types A, B and C) occur simultaneously, there could be a seemingly improving equity market environment, at least for a period of time. But if the chart types B and / or Chart C rallies are used to sell into strength or fail to materialize, another unwinding phase of the equity market environment may follow thereafter, as the individual structural forces of supply resume.
And finally, many of the topics and techniques discussed in this post are part of the CMT Associations Chartered Market Technician’s curriculum.
—
Originally Posted October 9, 2022 – All Advances Are Not Equal Within an Overall Bear Market Rally
Shared content and posted charts are intended to be used for informational and educational purposes only. The CMT Association does not offer, and this information shall not be understood or construed as, financial advice or investment recommendations. The information provided is not a substitute for advice from an investment professional. The CMT Association does not accept liability for any financial loss or damage our audience may incur.
Disclosure: CMT Association
Shared content and posted charts are intended to be used for informational and educational purposes only. The CMT Association does not offer, and this information shall not be understood or construed as, financial advice or investment recommendations. The information provided is not a substitute for advice from an investment professional. The CMT Association does not accept liability for any financial loss or damage our audience may incur.
Disclosure: Interactive Brokers
Information posted on IBKR Campus that is provided by third-parties does NOT constitute a recommendation that you should contract for the services of that third party. Third-party participants who contribute to IBKR Campus are independent of Interactive Brokers and Interactive Brokers does not make any representations or warranties concerning the services offered, their past or future performance, or the accuracy of the information provided by the third party. Past performance is no guarantee of future results.
This material is from CMT Association and is being posted with its permission. The views expressed in this material are solely those of the author and/or CMT Association and Interactive Brokers is not endorsing or recommending any investment or trading discussed in the material. This material is not and should not be construed as an offer to buy or sell any security. It should not be construed as research or investment advice or a recommendation to buy, sell or hold any security or commodity. This material does not and is not intended to take into account the particular financial conditions, investment objectives or requirements of individual customers. Before acting on this material, you should consider whether it is suitable for your particular circumstances and, as necessary, seek professional advice.

