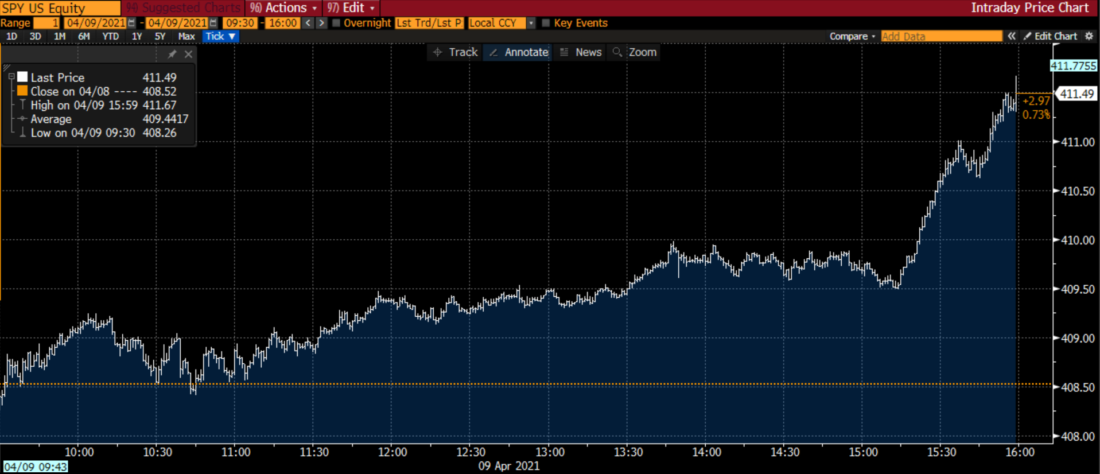
Please take a look at the following charts, and see if you can spot a recurring pattern. They show the price action of the SPDR S&P 500 ETF (SPY) on the last trading day of each of the prior three weeks. Pay special attention to the last hour of each. I am paying special attention to SPY because it represents the market’s main benchmark, and as an ETF it has options that expire after the close each Friday.
SPY 1 Day Price Chart, 4/9/21

SPY 1 Day Price Chart, 4/1/21

SPY 1 Day Price Chart, 3/26/21

Bear in mind that the middle chart is actually from a Thursday, since Friday, April 2nd was the Good Friday market holiday in the US.
More specifically, here are the charts that show the final hour of each of those trading days:
SPY 1 Hour Price Chart, 4/9/21, 15:00-16:00

SPY 1 Hour Price Chart, 4/1/21, 15:00-16:00

SPY 1 Hour Price Chart, 3/26/21, 15:00-16:00

All advanced sharply in that last hour of the trading day, but the pace was clearly the most aggressive on March 26th. At the time, I considered that to be a “gamma squeeze” at the end of a two-week period that saw a choppy selloff that climaxed a day prior:
SPY 10 Day Price Chart, 3/15/21-3/26/21

While I found the pace of the rally to be startling, I didn’t find it completely irrational. Traders were speculating that there could be portfolio managers rotating out of equities ahead of the end of the first quarter. That selling failed to fully materialize, and in the midst of a bull market it would not be unusual to see a snapback rally that followed a failed selloff. The rally took SPY back to the highs that it reached on March 17th, though it did so in a remarkably quick manner. When a reversal occurs, it can do so for many reasons. When it accelerates during the last hour of a trading week, the usual cause is traders racing to cover expiring short options positions. The following chart illustrates how this could be the case:
SPY 3/26/21 395 Calls, Volume Weighted Average on 3/26/21

Notice how the vast majority of the over 75,000 contracts that traded were at levels well below the $0.91 settlement price. Remember that in the world of options, for every long there is a short. Late that day, as SPY rose above 393, each of the traders who had short positions in what were low-delta, out-of-the-money expiring calls, suddenly found themselves with a much larger short delta position than they expected. Each of them had an incentive to cover that exposure, either with calls or the underlying SPY. That activity caused those who were short the 394 and 395 calls to experience the same concerns. That is a gamma squeeze in action.
At the time, I viewed the March 26th ramp as simply as a wild end to a wild week ahead of a quarter end. When it happened the following Thursday, I attributed it to traders not wanting to go home short ahead of a three-day weekend that featured the release of monthly employment statistics. Yet when it happened last Friday it struck me as a pattern. There was no obvious catalyst, yet the action was quite similar. Note the volume-weight average price (VWAP) for the expiring 410 calls (yes, SPY was up almost 4% in 2 weeks):
SPY 4/9/21 410 Calls, Volume Weighted Average on 4/9/21

While the price move was not as extreme as we saw on March 26th, the outcome was similar. The vast majority of options traded well below the eventual $1.67 settlement price.
Traders are constantly attempting to spot patterns and so are the algorithms that they program. If traders see an opportunity for markets to rally on a Friday, and a pattern that moves the odds of profitably exploiting a rally becomes evident, we can expect that some will attempt to exploit it. It will be very interesting to see what develops this Friday. Have the past few jumps prior to a weekly expiration become a tradeable pattern, or simply a three-in-a-row coincidence? Only time will tell.
In the meantime, consider the experience of those who were short 395 calls at about $0.10 an hour before the close on March 26th. It may seem frivolous or unnecessary to close out short positions in low-priced options, but that small expenditure can save you a significant amount of money.
—
Chart Sources: Bloomberg
Disclosure: Interactive Brokers
The analysis in this material is provided for information only and is not and should not be construed as an offer to sell or the solicitation of an offer to buy any security. To the extent that this material discusses general market activity, industry or sector trends or other broad-based economic or political conditions, it should not be construed as research or investment advice. To the extent that it includes references to specific securities, commodities, currencies, or other instruments, those references do not constitute a recommendation by IBKR to buy, sell or hold such investments. This material does not and is not intended to take into account the particular financial conditions, investment objectives or requirements of individual customers. Before acting on this material, you should consider whether it is suitable for your particular circumstances and, as necessary, seek professional advice.
The views and opinions expressed herein are those of the author and do not necessarily reflect the views of Interactive Brokers, its affiliates, or its employees.
Disclosure: Margin Trading
Trading on margin is only for sophisticated investors with high risk tolerance. You may lose more than your initial investment. For additional information regarding margin loan rates, see ibkr.com/interest
Disclosure: Options Trading
Options involve risk and are not suitable for all investors. Multiple leg strategies, including spreads, will incur multiple commission charges. For more information read the "Characteristics and Risks of Standardized Options" also known as the options disclosure document (ODD) or visit ibkr.com/occ


![[Gamma] Scalping Please [Gamma] Scalping Please](https://ibkrcampus.com/wp-content/smush-webp/2024/04/tir-featured-8-700x394.jpg.webp)


