


![[Gamma] Scalping Please](https://ibkrcampus.com/wp-content/smush-webp/2024/04/tir-featured-8-700x394.jpg.webp "[Gamma] Scalping Please")


CMT Association’s Market Insights features timely technical analysis of current global markets by veteran CMT charterholders. Each post appears on www.tradingview.com/u/CMT_Association/ in an effort to explain process, tools, and the responsible practice of technical analysis. Shared content and posted charts are intended to be used for informational and educational purposes only. The CMT Association does not offer, and this information shall not be understood or construed as, financial advice or investment recommendations. The information provided is not a substitute for advice from an investment professional. The CMT Association does not accept liability for any financial loss or damage our audience may incur.
Before we get started on trendlines and channels I want to share a quick thought on the current market environment and how, at least in my opinion, the technical environment has changed.
I believe that the weight of the evidence suggests that we are in the early to mid-stage of a primary bear market. If that is the case, momentum and sentiment extremes, breadth thrusts, and other conditions that have reliably produced tradable lows over the course of the recently completed primary bull market are far less likely to create meaningful/investable lows. For a low to be trusted for more than a quick trading turn will require multiple techniques and confirmations, while shorts into rallies and interim highs can be sold much more safely than at any time since the 2008 lows.
If global central banks, and in particular the Federal Reserve , continue to tighten policy, markets are at significant risk. In particular I believe that QT is the more important driver of asset prices. I don’t foresee a pivot anytime soon unless there is a financial accident. Even then, it’s not likely that the pivot will include a long term reversal of policy. If inflation remains high, pivots are likely to pauses in the tightening cycle and not a lasting reversal.
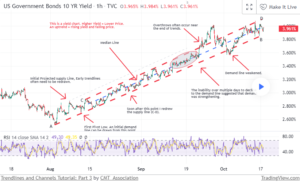
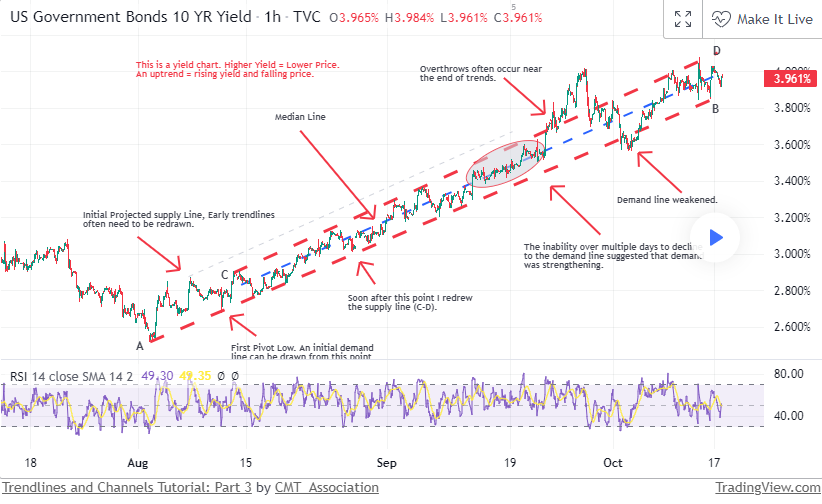
Ten Year Yields: For clarity and simplicity I will treat this uptrend in yield as a bull market (although it is actually a bear market as higher yield = lower price). To keep it simple I will label the uptrend in yields as if it were a bull market and use that terminology.
The hourly chart of US Ten Year Treasury Yield offers another example of a consistent demand line coupled with a clear supply line. As discussed in parts 1 & 2, trendlines and channel tops evolve over time and are typically messy.
Construction: Yields began inflecting higher in very early August (A) and over the next few weeks began making higher highs and higher lows.
The first significant low occurred August 10, and soon after, the initial demand line (A-B) could be drawn. This demand line did an excellent job of defining the stride of the trend for the next two months.
At that point there was a solid intervening high pivot between the two low pivots that could be used to draw the initial supply line. After the late August pivot , I moved my initial supply line lower.
From September 13- 22 the market traded in the upper portion of the channel for an extended period (period in the oval). Downside reactions began consistently holding in the area around the channel median/central line. This is typically a sign of strength. Note that this was the third time during the sequence that price had held in the upper portion of the band for an extended period. Granted, there were two periods where price was below median, but both periods were relatively short and the totality of time spent above median was far greater. This was clearly a market where demand is outstripping supply by quite a lot (remember that since this is yield, we are treating the uptrend as if it were price, so in actuality, holding in the top portion of the channel represented superior supply).
Soon after this show of strength, the market pushed above the top of the supply line. Overthrows of this nature are often terminal, ending the trend. Often, breakouts find fresh supply at roughly 1 channel width above the breakout. This one exceeded that modestly.
Often (as is the case here) once the original channel is reentered, it will again begin to act as support and resistance .
In the next installment we will talk about combining channels with other chart and oscillators and some notes about using channels to trade against.
And finally, many of the topics and techniques discussed in this post are part of the CMT Associations Chartered Market Technician’s curriculum.
—
Originally Posted October 17, 2022 – Trendlines and Channels Tutorial: Part 3
Shared content and posted charts are intended to be used for informational and educational purposes only. The CMT Association does not offer, and this information shall not be understood or construed as, financial advice or investment recommendations. The information provided is not a substitute for advice from an investment professional. The CMT Association does not accept liability for any financial loss or damage our audience may incur.
Disclosure: CMT Association
Shared content and posted charts are intended to be used for informational and educational purposes only. The CMT Association does not offer, and this information shall not be understood or construed as, financial advice or investment recommendations. The information provided is not a substitute for advice from an investment professional. The CMT Association does not accept liability for any financial loss or damage our audience may incur.
Disclosure: Interactive Brokers
Information posted on IBKR Campus that is provided by third-parties does NOT constitute a recommendation that you should contract for the services of that third party. Third-party participants who contribute to IBKR Campus are independent of Interactive Brokers and Interactive Brokers does not make any representations or warranties concerning the services offered, their past or future performance, or the accuracy of the information provided by the third party. Past performance is no guarantee of future results.
This material is from CMT Association and is being posted with its permission. The views expressed in this material are solely those of the author and/or CMT Association and Interactive Brokers is not endorsing or recommending any investment or trading discussed in the material. This material is not and should not be construed as an offer to buy or sell any security. It should not be construed as research or investment advice or a recommendation to buy, sell or hold any security or commodity. This material does not and is not intended to take into account the particular financial conditions, investment objectives or requirements of individual customers. Before acting on this material, you should consider whether it is suitable for your particular circumstances and, as necessary, seek professional advice.


