


![[Gamma] Scalping Please](https://ibkrcampus.com/wp-content/smush-webp/2024/04/tir-featured-8-700x394.jpg.webp "[Gamma] Scalping Please")


By: Jon Maier; Michelle Cluver, CFA; David Beniaminov, CFA
Rising Asset Correlations Went into Overdrive In 2022
Correlations across U.S equity, international equity, and fixed income rose in 2022 as global central banks increased policy rates to reduce consumer demand and curb inflation. For fixed income, the worst may have passed as the Federal Reserve (Fed) approaches a terminal rate of about 5%. For international markets, some headwinds have dissipated, while growth expectations in the U.S. have deteriorated slightly. As correlations between asset classes decline, we expect markets to find a balance between growth and value. So far, there have been clear winners and losers on the sector front, evidenced by the severity and breadth of the declines. This disparity could create investment opportunities, but selectivity will be key across asset classes and sectors amid tighter financial conditions.
Declining Correlations Could Create Opportunities In 2023
Conditions could be aligning for correlations between U.S. equities and fixed income to decline. The speed of rate increases in 2022 caused aggressive repricing in bonds and U.S. equities simultaneously. As the Fed policy rate nears 5.0%,1 the pace of rate hikes may subside.
Another factor is the cloudy outlook for U.S. equities in the first half of 2023 with investors expecting earnings contraction. About 55% of S&P 500 companies and 71% of the Nasdaq are trading below their 200-day moving averages (MA).2 In December, the estimated Q4 year-over-year earnings growth rate for the S&P 500 was revised to -2.8%, well below the 3.7% estimate at the start of the quarter.3 Weaker earnings growth could occur alongside rising recession risks, evidenced by the Conference Board Leading Economic Index’s (LEI) steep decline after peaking in February of 2022.4 The Conference Board projects a U.S. recession to occur around the beginning of 2023 and last through mid-year. In the meantime, a recession could lead to less restrictive monetary policy, creating investment opportunities.
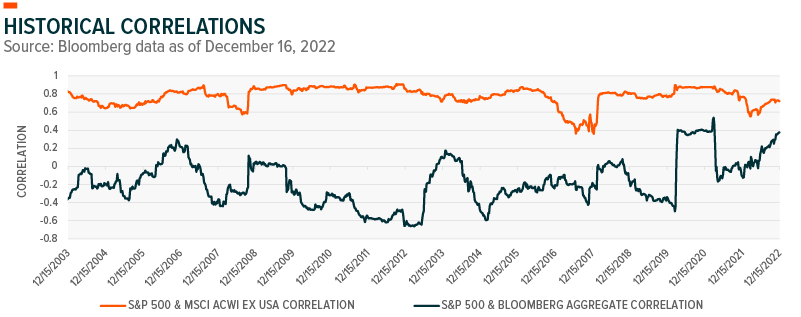
Asset class correlations ebb and flow, as seen in the chart below, which measures 1-year correlations using weekly rolling data over the past 20 years. To buffer the impact of market downturns on overall investment returns, investors can build diversified portfolios that include assets with low correlations.
Improving Global Opportunities
International markets may benefit as peak pessimism fades. European energy shortage fears have dissipated with gas storage adequate for the winter, while China shifting away from their zero-COVID policy reflects an increased prioritization of economic growth. Thematic equity is global in nature and potentially stands to benefit from improving global opportunities. However, with slower global economic growth and restrictive financial conditions, this is an important area to be selective. Clean tech, clean energy, cybersecurity, and robotics are a few themes that we believe continue to have structural tailwinds in the current environment.
- Clean Energy and Clean Tech: The war in Ukraine highlighted the need to expand clean energy infrastructure and clean tech investment in Europe and beyond. Beyond the focus on renewable solutions, this conflict highlighted the importance of energy independence.
- Cybersecurity: Heightened cybersecurity risks are a tailwind for topline growth. In the near term, we expect cybersecurity revenue to grow faster than the economy or the broad market.
- Robotics & Artificial Intelligence: Broad structural forces are increasing the need for improved efficiency, driving increased demand for automation.
Sector Selectivity Will Be Key
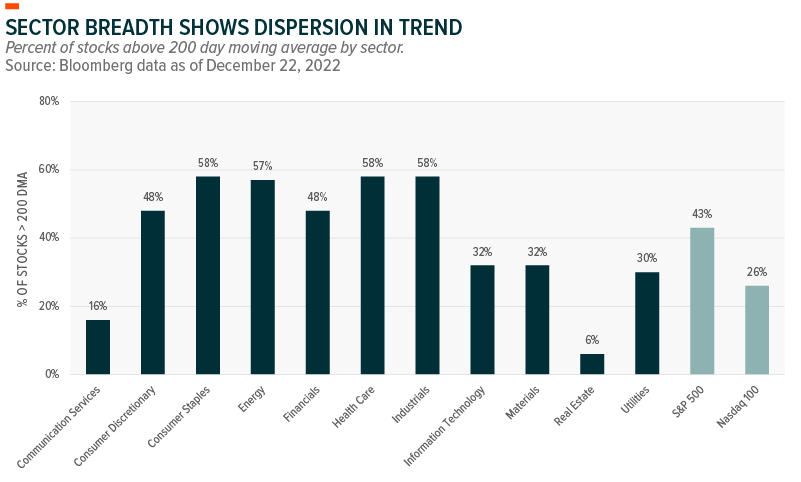
Dispersion in sector price trends could narrow in 2023 as growth headwinds subside. The chart below shows the percentage of stocks in each sector trading above their 200-day moving average. Consumer Staples, Energy, Health Care, and Industrials have maintained their respective uptrends, especially relative to the S&P 500. However, Real Estate, Materials, Industrials, and Communication Services have significantly lower breadth readings. The weaker economy weighed on cyclical sectors, while rising interest rates adversely impacted high valuation growth sectors.
Breadth can also be a measure of overbought or oversold conditions. Stocks tend to revert to the mean after trading well above or below their 200-day moving averages. Investors may expect a catalyst to balance the scale between growth and value. A slower pace of rate hikes could benefit long duration assets, while improved global growth prospects may positively impact cyclical growth sectors relative to defensives. For now, there is still room for earnings expectations to decline, which could present downside risks in H1 2023.
Lower Earnings Expectations Closer To Reality
The S&P 500’s expected year-over-year earnings growth rate for 2022 is 5.1% (-1.8% excluding Energy), compared with estimates of 9.1% in June and 6.9% in September for the same period at different times.5 Lower expectations from 2022 will likely feed into 2023 alongside a decline in Buy ratings.
Energy, Communication Services, and Information Technology have the highest percentages of analyst Buy ratings, while Consumer Staples and Utilities have the lowest. The concentration of Buy ratings is essentially an inverse of the breadth chart above. December 2021 had a similar makeup of Buy, Hold, and Sell ratings, although sector performance outside of Energy greatly disappointed consensus ratings in 2022.6
Despite bearish earnings expectations, investors can still find opportunities. Positioning between sectors will be an important consideration for portfolio diversification in 2023. Declining earnings expectations and the normalizing correlations between stocks and bonds could cause a shift in the relative volatility between equities and bonds. Therefore, a tilt toward defensive and quality sectors could mitigate downside risk. However, as global growth conditions improve, growth sectors could gain, creating opportunities for thematic equities. Some of our high-conviction themes include Cybersecurity, Infrastructure, and Clean Energy, with each benefiting from improving demand.
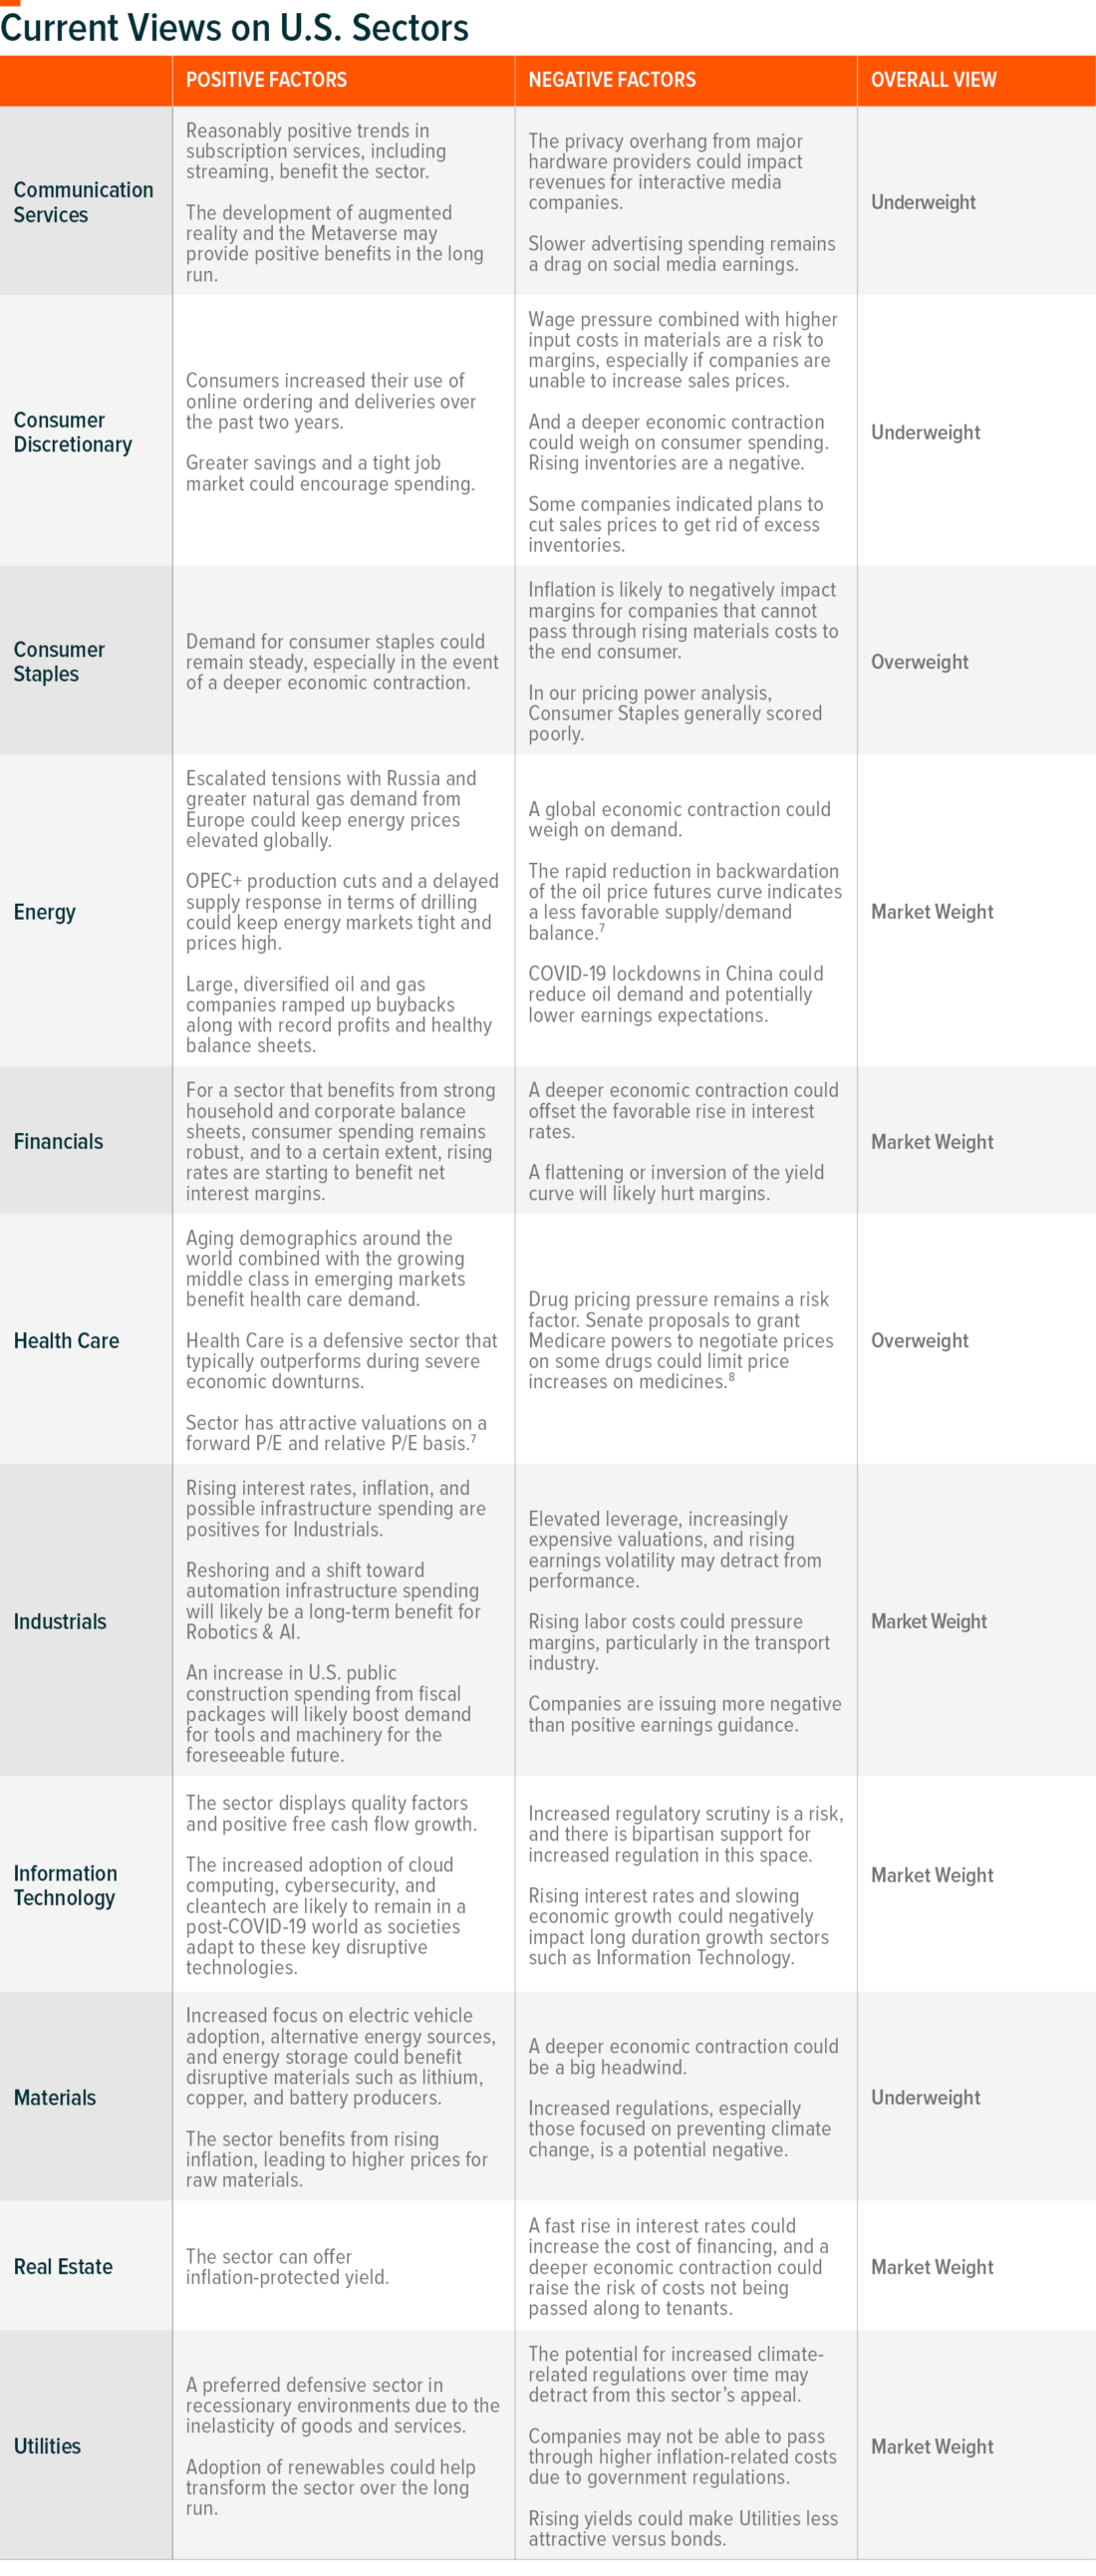
Our sector views table below provides more detail on sector positioning and the current tailwinds and headwinds for each sector.
FOOTNOTES
1. CME Group, FedWatch Tool, December 23, 2022
2. Bloomberg, Market Breadth Data, December 22, 2022
3. FactSet, Earnings Insight, December 15, 2022
4. The Conference Board, LEI for the U.S. Declined Again in November, December 22, 2022
5. FactSet, S&P 500 CY 2022 Earnings Preview, December 16, 2022
6. FactSet, Where Are Analysts Most Optimistic on Ratings for S&P 500 Companies Heading Into 2023,
December 19, 2022
7. Bloomberg, U.S. Oil Futures Point to Oversupply for First Time This year, November 18, 2022
8. Yardeni Research, S&P 500 Industry Briefing: Health Care, November 29, 2022
9. CNBC, ‘Once-in-a-generation’ Prescription Drug Pricing Reform Could be Coming, July 29, 2022
GLOSSARY
NASDAQ 100: The NASDAQ 100 index includes 100 of the largest non-financial companies listed on its stock market.
S&P 500 Total Return Index: The index includes 500 leading U.S. companies and captures approximately 80% coverage of available market capitalization.
—
Originally Posted January 4, 2023 – The Benefits of Lower Correlations
This material represents an assessment of the market environment at a specific point in time and is not intended to be a forecast of future events, or a guarantee of future results. This information is not intended to be individual or personalized investment or tax advice and should not be used for trading purposes. Please consult a financial advisor or tax professional for more information regarding your investment and/or tax situation.
Global X Management Company LLC serves as an advisor to the Global X Funds.
Disclosure: Global X ETFs
Carefully consider the Fund’s investment objectives, risk factors, charges and expenses before investing. This and additional information can be found in the Fund’s full or summary prospectus, which may be obtained by calling 1-888-GX-FUND-1 (1.888.493.8631), or by visiting globalxfunds.com. Read the prospectus carefully before investing.
Disclosure: Interactive Brokers
Information posted on IBKR Campus that is provided by third-parties does NOT constitute a recommendation that you should contract for the services of that third party. Third-party participants who contribute to IBKR Campus are independent of Interactive Brokers and Interactive Brokers does not make any representations or warranties concerning the services offered, their past or future performance, or the accuracy of the information provided by the third party. Past performance is no guarantee of future results.
This material is from Global X ETFs and is being posted with its permission. The views expressed in this material are solely those of the author and/or Global X ETFs and Interactive Brokers is not endorsing or recommending any investment or trading discussed in the material. This material is not and should not be construed as an offer to buy or sell any security. It should not be construed as research or investment advice or a recommendation to buy, sell or hold any security or commodity. This material does not and is not intended to take into account the particular financial conditions, investment objectives or requirements of individual customers. Before acting on this material, you should consider whether it is suitable for your particular circumstances and, as necessary, seek professional advice.


