


CMT Association’s Market Insights features timely technical analysis of current global markets by veteran CMT charterholders. Each post appears on www.tradingview.com/u/CMT_Association/ in an effort to explain process, tools, and the responsible practice of technical analysis. Shared content and posted charts are intended to be used for informational and educational purposes only. The CMT Association does not offer, and this information shall not be understood or construed as, financial advice or investment recommendations. The information provided is not a substitute for advice from an investment professional. The CMT Association does not accept liability for any financial loss or damage our audience may incur.
In installments 1 – 4 we built a market momentum matrix and plotted the information onto a stylized business cycle. In this installment we will make final observations and thoughts around the current cycle.
Capital flows into and out of commodities , sectors and equities have historically provided a direct reflection of the markets view of the business cycle. But, over the last two decades the tsunami of fiscal and monetary liquidity distorted business and market cycles. As the liquidity lifted all asset classes analysis that depended upon normal intermarket relationships became less useful. Now that the reemergence of inflation as a threat is likely to constrain central banks. In other words, markets will again become properly anticipatory to the business cycle.
As a reminder, this is the distilled version of the momentum matrix we built in the first 3 installments.

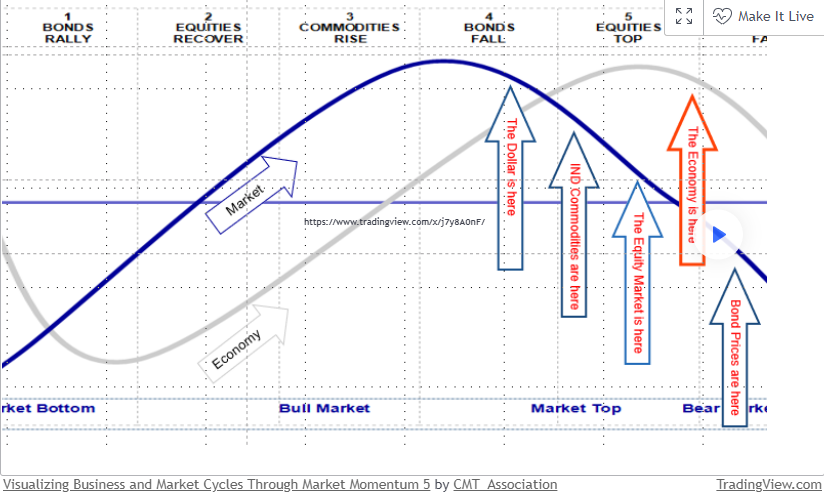
This is the momentum stylized market and economic cycle sine curves. If markets (dark blue curve) are correctly anticipating the business cycle (grey curve) the business cycle is moderatly past peak, and should be expected to steadily deteriorate over coming quarters.

Observations:
The matrix is entirely consistent with an weakening business cycle that has yet to trough. Over the last two years rising short and long rates led the cycle lower. Equities, responding to higher rates, turned lower this year and both industrial and aggricultural commodities are now weakening as economic demand wanes. The outlier is the Dollar. It has benefited from global flight to quality, carry and the aggresiveness of our central bank verses other central banks. But, of the asset classes, the Dollars relationship to the business cycle is the least consistent.
Rates clearly led this cycle lower and it is likely that they will lead the next cycle higher. It is important to note that short rates have risen more than long rates. This has created the type of highly reliable yield curve inversion that signals a coming recession. I believe that the inversion represents a “get ready” warning. A rapid reversal in which short rates fall more quickly than long rates, will be the signal that the reccession is beginning. Once the reccession matures, falling rates, will eventually result in better equities, higher commodities , and an improving business’ cycle. Rapidly falling rates should be viewed as a signal that the worst of equity declines is likely in the past.
Equities typically trough before the low point of the economic cycle . As the recession matures, technical lows in equity charts should offer important macro entry points.
As the flight to quality that occurred in 2022 runs its course and the economic cycle becomes more normal the DX will begin influencing commodities again. The Dollar and commodities TEND to trend in opposite directions but the Dollars relationship to other asset classes and the cycle is highly variable.
Eventually markets will realize that the new macro backdrop is one of persistent inflation rather than persistent deflation. Central banks will be more focused on fighting inflation and liquidity, except during episodes of explicit systemic risk, will be far more constrained. As a result, the rates/commodity/equity link will become strong again. Generally speaking, more frequent periods of higher inflation will result in higher yields, a slowing economy, lower commodities , lower earnings and lower equities.
A note on the bond — equity relationship:
The relationship changes over time depending upon the market’s preoccupation with inflation or deflation. Prior to 1997 a fall in yields was bullish for equity as yields were declining in reaction to a falling inflation rate. After the inflation of the 70s, bonds and equity entered simultaneous bull markets as the deflationary forces generated by globalization and technological advance allowed Central banks to become more accommodative without fear of igniting inflaiton. In a deflationary environment, bonds rise when equities fall and act as a hedge to equities. In an inflationary environment both stock and bond prices eventually decline. I suspect that the inflation regime has changed.
Conclusion: 1) The business cycle is likely to weaken significantly over coming months. 2) A rapid decline in rates accompanied by a sharply steeper curve, will likely mark the actual beginning of the recession. 3) The recession itself should produce an excellent entry macro entry point for equity. 4) Man plans, god laughs. 5) Happy New Year to all!
And finally, many of the topics and techniques discussed in this post are part of the CMT Associations Chartered Market Technician’s curriculum.
—
Originally Posted January 3, 2022 – Visualizing Business and Market Cycles Through Market Momentum 5
Shared content and posted charts are intended to be used for informational and educational purposes only. The CMT Association does not offer, and this information shall not be understood or construed as, financial advice or investment recommendations. The information provided is not a substitute for advice from an investment professional. The CMT Association does not accept liability for any financial loss or damage our audience may incur.
Disclosure: CMT Association
Shared content and posted charts are intended to be used for informational and educational purposes only. The CMT Association does not offer, and this information shall not be understood or construed as, financial advice or investment recommendations. The information provided is not a substitute for advice from an investment professional. The CMT Association does not accept liability for any financial loss or damage our audience may incur.
Disclosure: Interactive Brokers
Information posted on IBKR Campus that is provided by third-parties does NOT constitute a recommendation that you should contract for the services of that third party. Third-party participants who contribute to IBKR Campus are independent of Interactive Brokers and Interactive Brokers does not make any representations or warranties concerning the services offered, their past or future performance, or the accuracy of the information provided by the third party. Past performance is no guarantee of future results.
This material is from CMT Association and is being posted with its permission. The views expressed in this material are solely those of the author and/or CMT Association and Interactive Brokers is not endorsing or recommending any investment or trading discussed in the material. This material is not and should not be construed as an offer to buy or sell any security. It should not be construed as research or investment advice or a recommendation to buy, sell or hold any security or commodity. This material does not and is not intended to take into account the particular financial conditions, investment objectives or requirements of individual customers. Before acting on this material, you should consider whether it is suitable for your particular circumstances and, as necessary, seek professional advice.
Disclosure: Futures Trading
Futures are not suitable for all investors. The amount you may lose may be greater than your initial investment. Before trading futures, please read the CFTC Risk Disclosure. A copy and additional information are available at ibkr.com.


