


Study Notes:
Investors buy stocks in the expectation that share values will increase. To measure overall performance, they like to compare their returns with a common benchmark such as the S&P 500 index. Over time, individual share prices form a relationship or correlation with the benchmark. Some stocks behave just like the benchmark, rising or falling exactly in line with it. Some stocks have inherent characteristics that make them behave in a certain way. When the benchmark index increases in value, some stocks rise faster. And when the index falls, the stock’s losses are deeper. The nature of this sensitivity is defined by a stock’s beta.
Technology related stocks tend to be more sensitive to the market, which is why many investors like them. Companies such as those in the utility sector have more defensive characteristics and tend to lag movement higher in the market. But as the market declines, such defensive characteristics causes them to fall less slowly, and sometimes buck the down trend altogether. We’ll take more about beta in a bit.
Let’s follow the implication of the sensitivity of a stock to a benchmark through to a portfolio. If stocks behaved in a uniform fashion to the movement in a benchmark, for a given change in the benchmark, the component stocks would change by approximately the same amount. The respective weighting of each stock would, therefore, remain constant over time.
However, when we consider that stocks behave independently and move by the approximate amount of the observed beta reading, the portfolio can be thought of containing stocks whose weighting can change over time due to that sensitivity to the beta calculation. This allows us to consider the concept of beta weightings within a portfolio and beta-weighted dollars.
Let’s explore the concept of Beta a little further. Beta measures the sensitivity of a security to an underlying benchmark such as a stock index. Calculations are made from daily returns over the past two-years.
Stocks that are sensitive to the performance of the reference benchmark have a high Beta, while stocks that move relatively less have a low Beta. Earlier I gave the examples of tech stocks being more sensitive or high Beta, and utility stocks being less sensitive or low Beta.
If you consider that the underlying index has a Beta value of 1.0, stocks that are sensitive to the performance of the reference benchmark have Beta greater than 1.0. Stocks that move relatively less than the index have a Beta less than 1.0.
Beta can be used to estimate the expected return on an asset given the return on a statistically related asset.
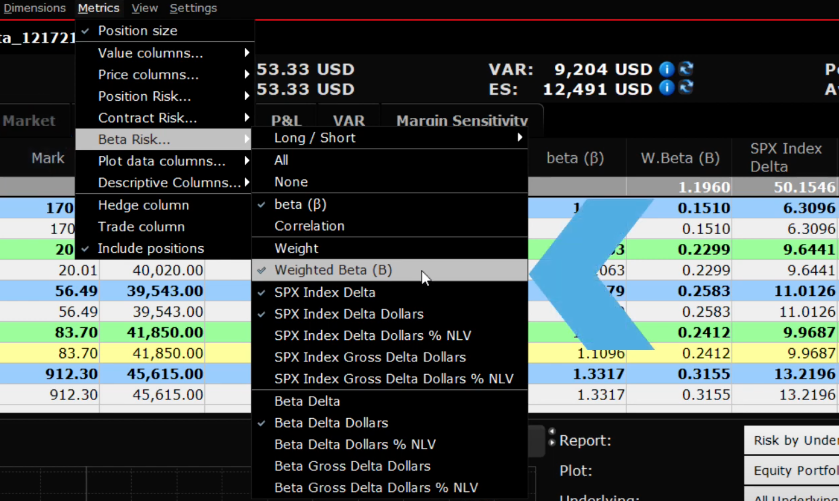
The Risk Navigator offers the ability to view a portfolio through the lens of both equal-weighted and Beta weighted metrics. To turn on the Beta weighting metrics, from the Metrics menu under the Beta Risk elements select Beta, Weight and Weighted Beta to add them to the display.
Let’s look at a couple of metrics under the regular equal weighted view in a Risk Navigator display.
In this what-if portfolio, I will add columns to demonstrate what we are looking at and highlight its importance as we progress. To begin with the display shows Underlying, Position, Mark and Value and I have added a handful of stocks to illustrate the concept of Beta or sensitivity to the market. (e.g. TSLA, TELL, SCHW, AAPL, F, GM, SPY).
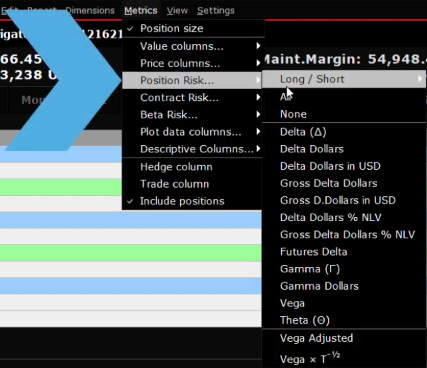
Next, I’m going to add three columns, all of which are located under the Metrics menu. Access Metrics, Position risk and Delta dollars. And then we’ll add the stocks’ Beta reading from Metrics, Beta risk and then select Beta. And I’ll add the weight from Metrics, Beta risk and then add Weight.
For an equal weighted display, you can see that for stocks, the readings of Value and Delta dollars are the same. Notice the overall Delta dollar value for the portfolio. Now estimate 10% of that value. In the Plot Viewer below, using the Vertical Crosshairs, we can easily read off from the chart the impact of a +/-10% move in the reference index and gauge expected P&L. So now you can see that if we assume a 10% gain in the value of the portfolio, we are assuming an across the board 10% gain for each underlying.
However, the Beta reading for each stock reminds us that each stock is likely to move at a different pace when the benchmark index moves. Clicking on the Beta column header will sort the stocks from high to low Beta and then low to high. Here we have the portfolio ranked by stock sensitivity as measured by the reading of Beta. It stands to reason that higher Beta stocks will have a greater impact on the portfolio when the benchmark index changes.
So now let’s add another column from the Metrics menu so that we can see the Beta weighted dollar reading for a stock. Stocks with a higher beta reading will have a higher Beta weighted dollar value and will impact the value of the portfolio more when the benchmark moves. Conversely, stocks with a low Beta reading will have a lesser impact when adjusted for weighting in the portfolio.
Now compare the reading for Delta dollars against the Beta Weighted Delta dollars reading. The stock’s Beta is used to adjust the relative weighting within the portfolio. In this example portfolio, you can see that, since there are several high Beta stocks, the overall Beta Weighted Delta dollar reading is higher than the delta dollar value of the equal weighted portfolio.
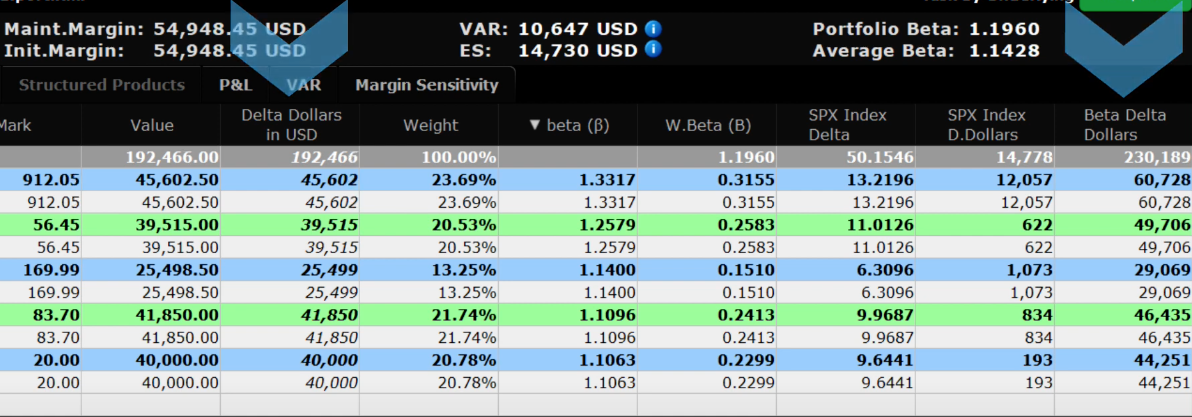
To add some perspective here, consider that a portfolio with higher Beta weightings, is likely to respond more aggressively when the market rises. And conversely, losses are potentially larger when the market declines. For this portfolio, the adjusted Beta Weighted Delta dollar reading is therefore higher than under equal weighted rules.
We can confirm this by checking for a 10% rise in the value of the portfolio under both cases in the Plot Viewer.
Under equal weighting you can see what a 10% gain means in dollar terms. Compare that to the reading of Delta dollars.
Click the button above the Plot Viewer to enter Beta Weighted mode and hover the cursor at up 10% on the Plot to confirm the distinction.
The Equal Percentage method will calculate the expected impact on the Portfolio should the reference index move up or down, using the Weight of each stock. By contrast, the Beta Weighting method projects expected profit and loss given the composition of stocks and their historic performance relative to the benchmark.
Understanding these alternate methods for portfolio monitoring purposes is important to risk managers. An equal-weighted plot most accurately represents occasions when the market moves as a whole, such as during a large market dislocation.
A beta-weighted plot better reflects the day-to-day statistical variation of the market prices.
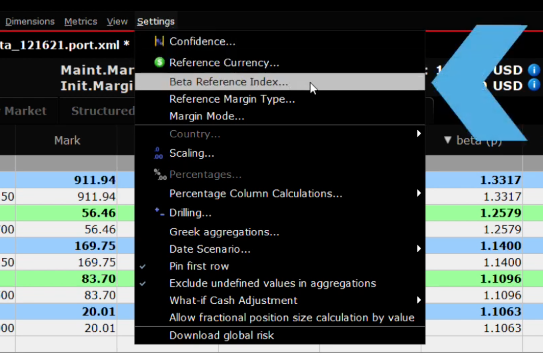
My default benchmark index in risk Navigator is the S&P 500 index. To change the chosen reference index, use the Settings menu and select from available items in the Beta Reference index selector.
Finally, you may change the time period of beta calculation, whose default time period is the last two years. Access from the Edit dropdown menu and select from choices of either Custom or Date Interval range. The Custom Horizon allows users to determine the number of years, months or days. The Date Interval allows users to select specific Start and End Dates. Each allows users to drive the calculation using daily, weekly or monthly computations.
Join The Conversation
If you have a general question, it may already be covered in our FAQs. If you have an account-specific question or concern, please reach out to Client Services.