


![[Gamma] Scalping Please](https://ibkrcampus.com/wp-content/smush-webp/2024/04/tir-featured-8-700x394.jpg.webp "[Gamma] Scalping Please")


Study Notes:
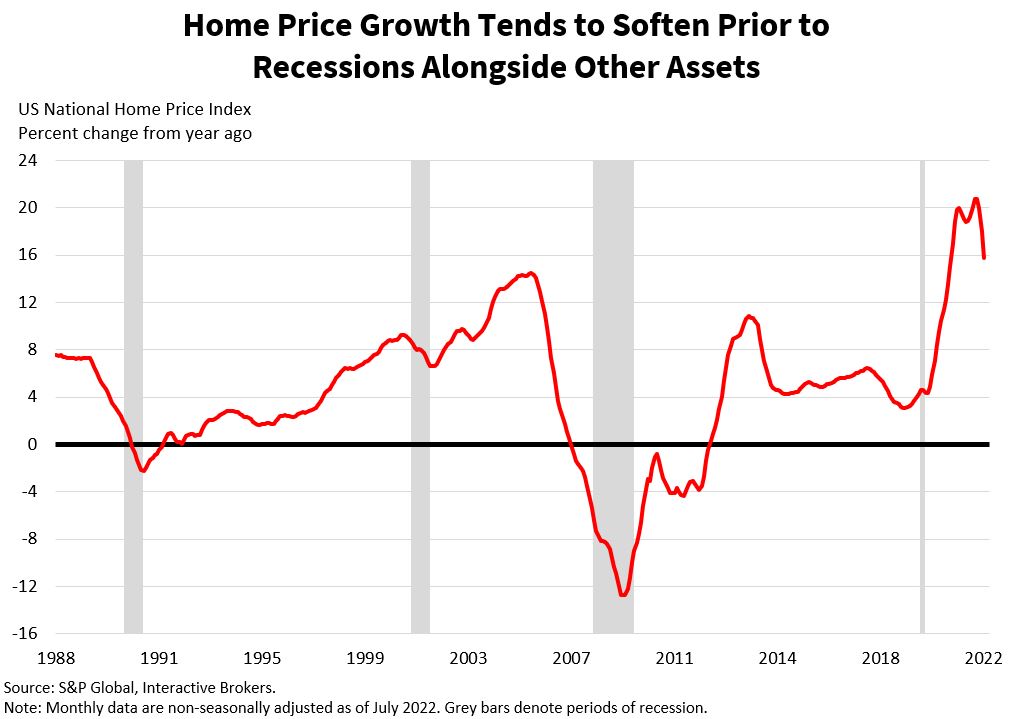
Home prices are a hot topic among investors because real estate has a huge impact on consumer sentiment and more broadly, gross domestic product. Home price data, is provided by various organizations, but one significant provider is S&P Global, which maintains the CoreLogic Case-Shiller Index. The data is available in three versions. The 10- and 20-metropolitan areas indices and a national version index. S&P Global observes single-family homes that have been sold repeatedly with arms- length transactions. The first sales price and the second sales price for the same property are referred to as “pairs.” The difference with each pair is used to calculate changes in real estate values within the respective areas. S&P Global releases the data on the last Tuesday of each month at 9:00am eastern time. S&P Global provides home price data to help governments, financial institutions, corporates and market participants forecast, analyze and plan for current and future economic developments.
Changes in home prices can provide valuable insight into the economy. When home prices increase, homeowners perceive that their finances are improving, which in turn strengthens consumer sentiment. As sentiment improves, consumers are more likely to buy goods and splurge on entertainment and other services. Weakening real estate prices, of course, have the opposite effect. When real estate prices declined in the U.S. during the 2008 financial crisis, it corresponded with slowing economic growth, slower consumer spending and weakness across many economic data points.
 Price changes are also a broad indication of the overall economy, because economic growth often strengthens the labor market and wages. With higher incomes, individuals are more likely to purchase homes and this increase in demand can cause prices to climb. Home purchases can also have a ripple effect within the economy. New homeowners typically purchase furniture, appliances, kitchen items, landscaping supplies and various other items. A strong real estate market as illustrated by home prices can also imply increased demand for mortgages, which support bank earnings. In a similar manner, a strong real estate market can cause home builders to increase construction, which may require them to hire additional workers.
The desire for homebuilders to supply housing, demand for housing from consumers, and the cost of capital and materials are important variables to analyze when looking at real estate markets. To forecast housing prices look at homebuilder sentiment, home sales, expected credit conditions, mortgage applications, and daily commodity prices to get an idea of how builders, banks, consumers and investors feel about the trajectory of the real estate market. Also, look at the price action and listen to the conference calls of some of the largest real estate builders, operators and providers. KB Home, Toll Brothers, Lennar, DR Horton, AvalonBay, Equity Residential, Essex Property Trust, Builders FirstSource, Lowe’s and NVR are some to pay attention to.
While not typically a market moving data release, the market will decline further if home prices are worse than expected, and rise more if better than expected. Higher home prices means greater purchasing power, more economic activity and an environment that will likely benefit stocks globally.
For a large portion of the world’s population, buying a home is the single largest transaction they’ll ever make. Tracking the capital intensive and interest rate sensitive real estate sector for signs of economic strength or weakness is an important aspect of economic analysis.
Additional Resources
Join The Conversation
If you have a general question, it may already be covered in our FAQs. If you have an account-specific question or concern, please reach out to Client Services.