


Study Notes:
Industrial Production tells us how much physical production is occurring within the industrial sectors of the United States. It represents the amount of production occurring within the manufacturing, mining and utilities industries. In addition, it breaks down production by major market groups such as consumer goods, business equipment, construction and materials. Another aspect of the industrial production report is capacity utilization or CAPU. CAPU tells us what percentage of capacity is being used. If a computer manufacturer can make one-thousand computers a day but only makes nine-hundred, the CAPU is ninety percent. Market participants generally look for seasonally adjusted monthly changes in industrial production to analyze the productive yields of the U.S. economy. The industrial production and capacity utilization report is calculated and published by the American Central Bank, the Federal Reserve.
It’s calculated by using a mix of estimates from professional trade organizations and government agencies. Generally, it’s published on or around the fifteenth day of each month at 9:15am eastern time. The FED provides economic data as part of its mission to promote the health of the U.S. economy and the stability of the U.S. financial system.
The published report tracks industrial production as an indicator of the economy’s productivity and provides critical information concerning the state of consumer demand, producer yields and producer efficiency. A rise in industrial production is a confirmation signal that the economy is growing as a result of the industrial sector producing more goods, likely due to additional consumer demand. If industrial production declines, that’s a confirmation signal that the economy is slowing down or decreasing into recession, since the industrial sector is likely producing less goods due to declining consumer demand. Capacity utilization on the other hand can provide signals on the efficiency of the industrial sector while capacity itself acts as a speed limit to the industrial sector’s growth. If capacity expands, the chances of higher industrial production increases. If capacity contracts on the other hand, the more likely that industrial production decreases.
The capital intensive and interest rate sensitive nature of the industrial sector acts as a strong predictor of the future economic path. A decline in industrial production may have negative consequences globally. If production in the U.S. decreases due to higher interest rates, lower consumer demand, or supply chain disruptions, some economic impacts might include layoffs at factories, which in turn has the potential to cause those workers subject to decreases in income to purchase fewer goods and services from the local and global economy. As an example, the partial shift of the manufacturing sector from the U.S. to lower cost countries contributed to significant losses in economic activity in former manufacturing strongholds in the U.S.
Manufacturing Employment Fell By 7 Million People Since Its Highs in 1979
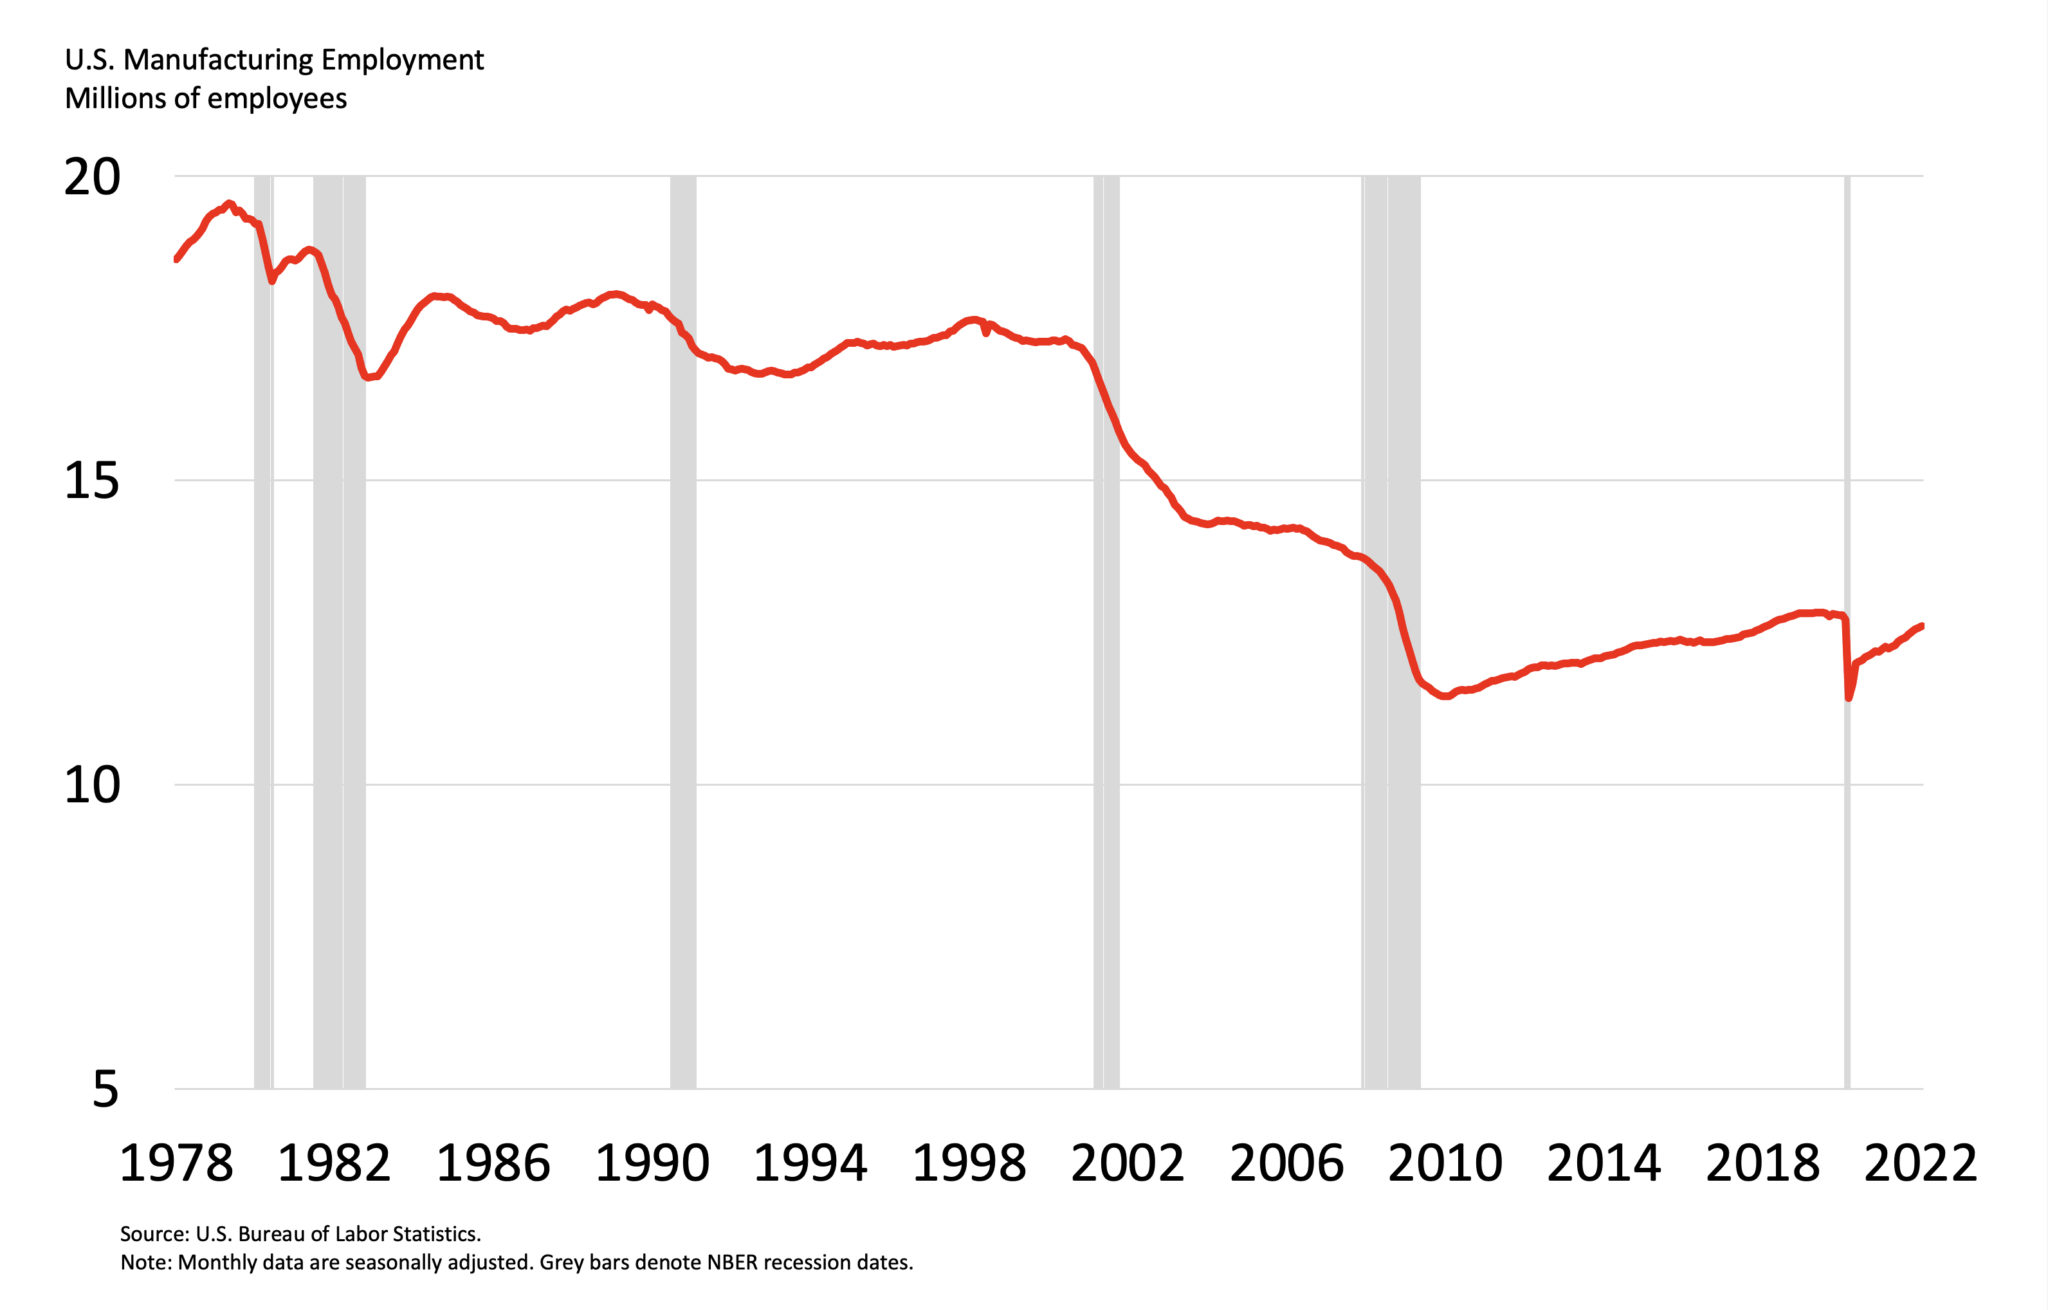
The manufacturing sector shrank significantly since its highs in the 1970s and the effects of industrial layoffs are still visible in the hardest hit-areas as vacant homes, vacant factories and depressed labor markets provide nostalgia of a more prosperous time.
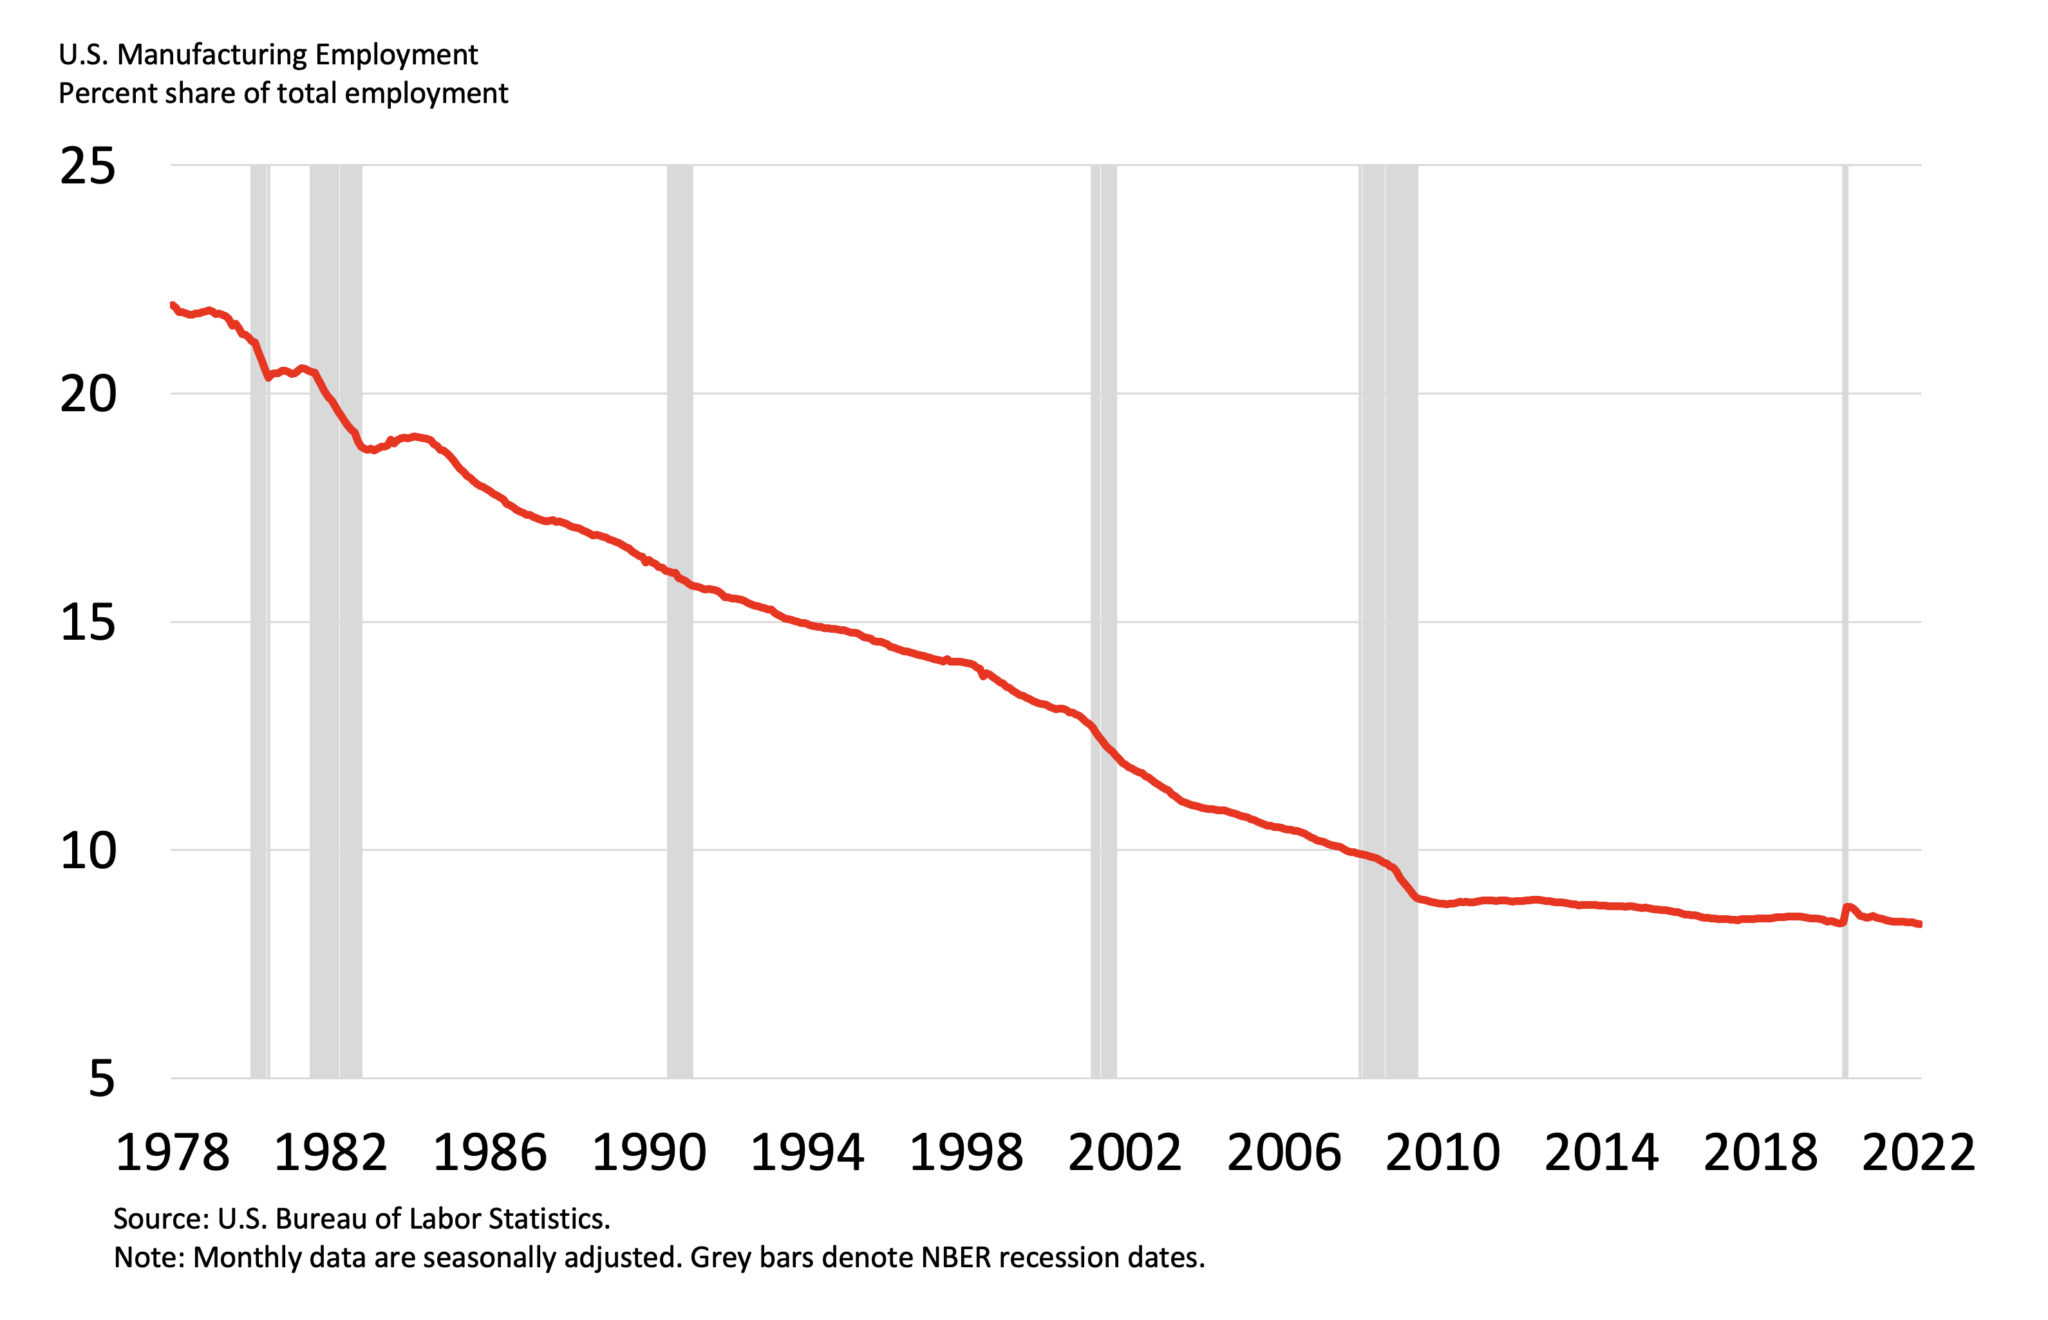
Manufacturing’s Share of Total Employment Fell From 22 Percent in 1978 to 8 Percent today
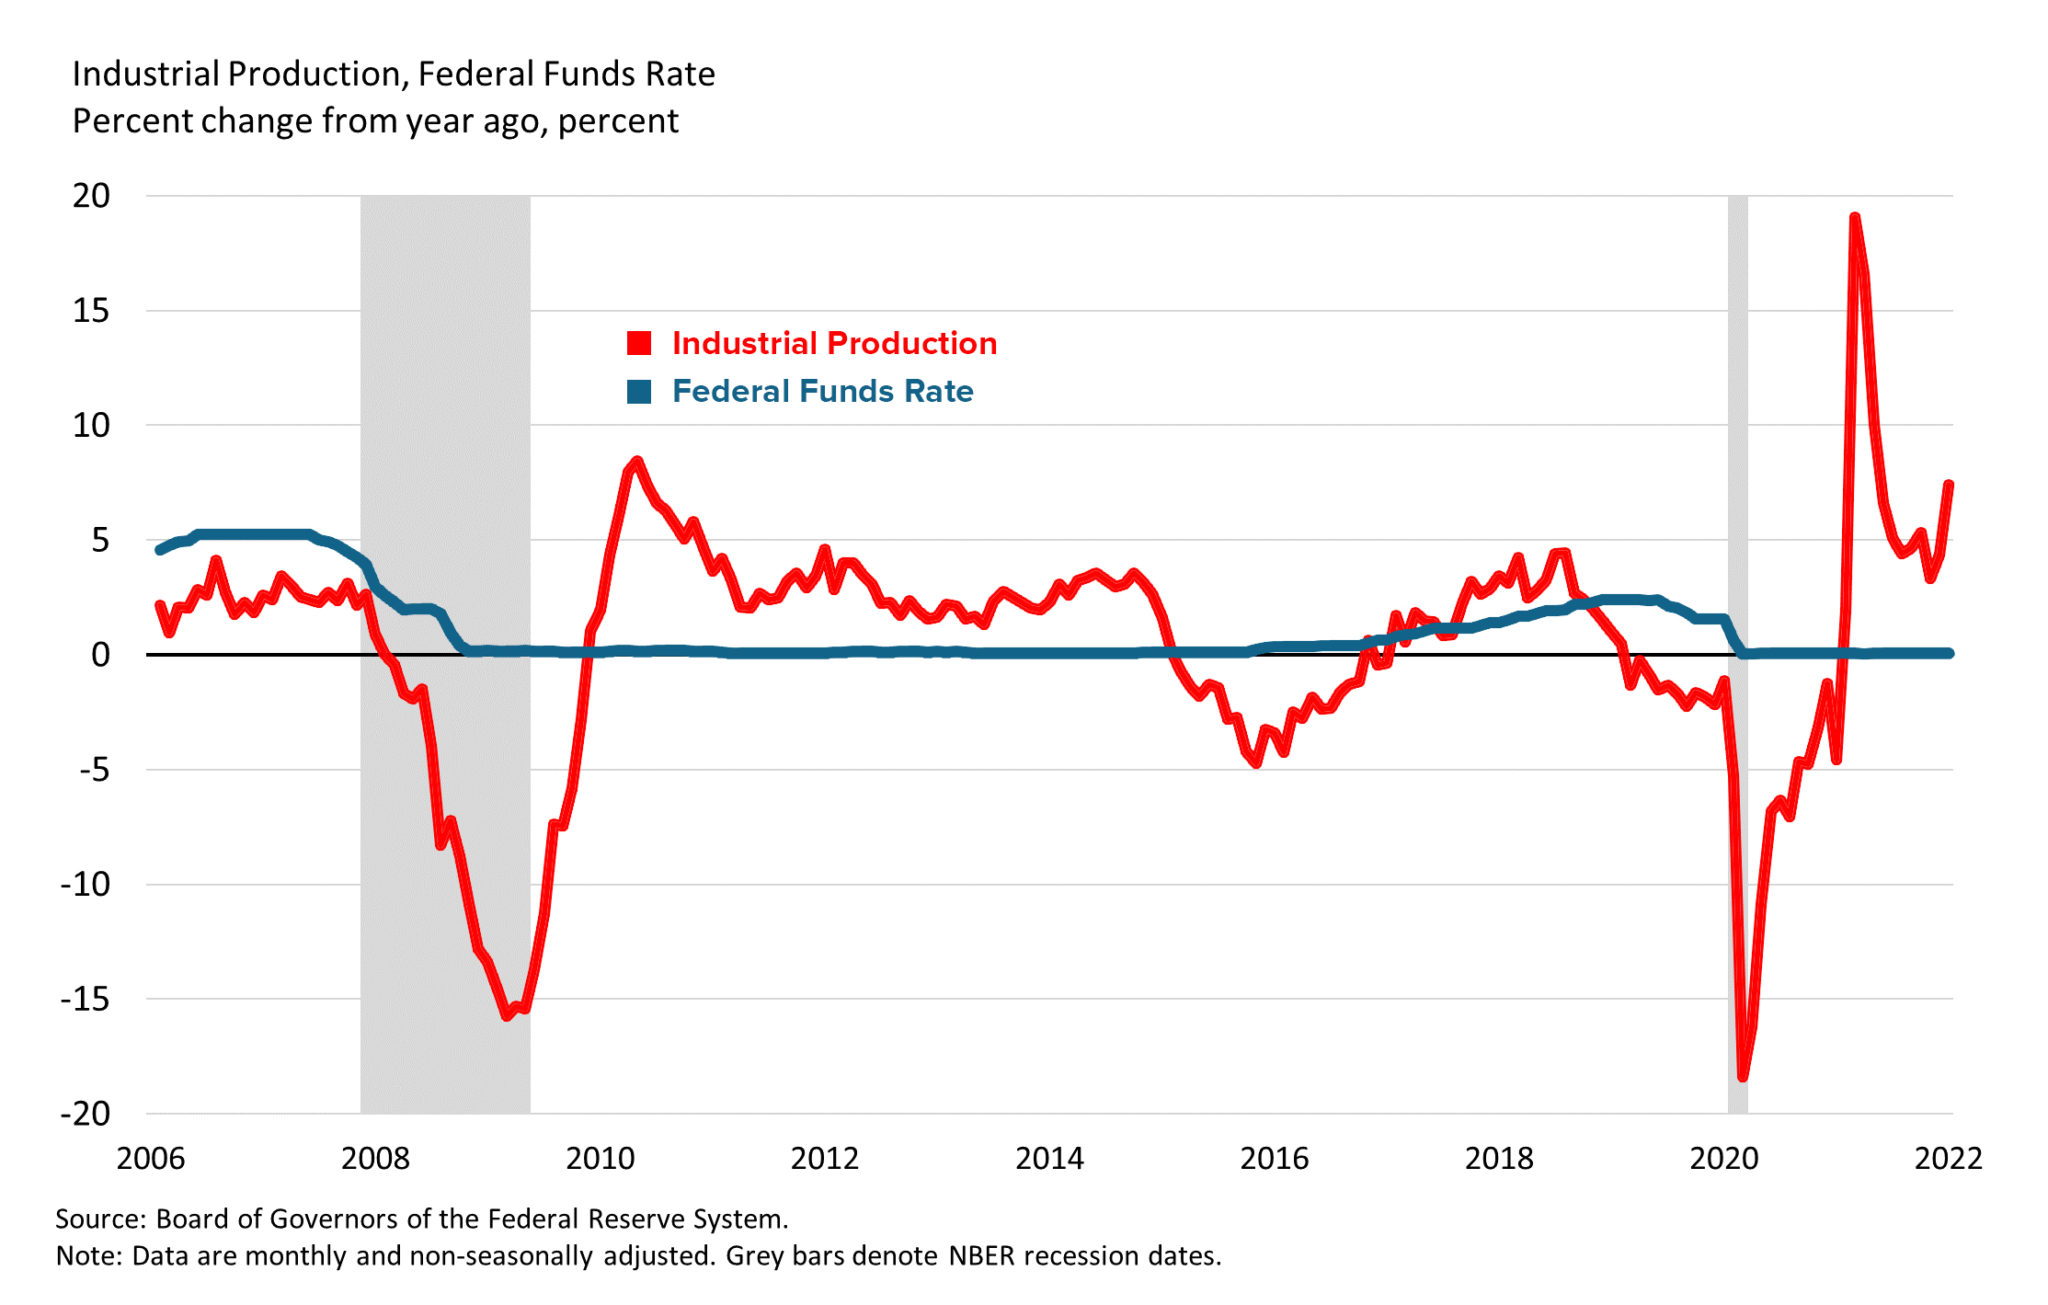
Industrial conditions are important to track because contagion effects can ripple through other sectors both domestically and globally. Industrial production shrank during the COVID-19 recession, the great financial crisis in 2008, in 2016 and in 2019 at least partially as a result of tighter policy and/or reductions in consumer demand.
Industrial Production Shrank Due To Higher Rates and/or Weaker Consumer Demand in 2008, 2016, 2019 and 2020
To forecast industrial production, look at economic indicators such as weekly unemployment claims to see if layoffs have reduced demand for manufactured goods, durable goods orders to measure the strength of consumer demand for high-cost goods, Purchasing Managers’ Index for manufacturing to measure the strength of producer order flows and sentiment, weekly steel production and daily commodity price action to gauge how manufacturing inputs are performing, and look at expected credit conditions to monitor business credit access since industrial activities are capital intensive. In addition, listen to the earnings calls and monitor the stock performance of the large manufacturing and mining companies. Look for signs of an economic slowdown or expansion. Caterpillar, Boeing, Exxon Mobil, Chevron, Northrop Grumman, Sherwin-Williams, Toyota, Ford, Raytheon, General Electric, Apple, Samsung and others are some to pay attention to.
Monitoring the monthly industrial production report is useful as it confirms a growing or shrinking economy through an industrial lens.
Join The Conversation
If you have a general question, it may already be covered in our FAQs. If you have an account-specific question or concern, please reach out to Client Services.