


![[Gamma] Scalping Please](https://ibkrcampus.com/wp-content/smush-webp/2024/04/tir-featured-8-700x394.jpg.webp "[Gamma] Scalping Please")


Study Notes:
IBKR’s Trader Workstation Risk Navigator is a real-time market risk management platform. This course will go through its features and tools using examples to demonstrate how these tools work in real world scenarios.
The Risk Navigator can be accessed in the New Window menu by scrolling down to Portfolio Tools in the Other Tools area. Highlight Portfolio Tools and hover over Risk Navigator: you will see four choices to open, “My Portfolio”, “Multiple Account Portfolio”, “New What-if”, and “Saved What-If”.
We’ll go into further details on these as well as other ways to bring up Risk Navigator later in the course. But first let’s take a tour of the general layout and features by bringing up a Risk Navigator What-if already populated with a portfolio.
Let us start at the top on the title bar. This displays the portfolio name and type as well as displaying the menus. The menu items are: Portfolio, Edit, Report, Metrics, View and Settings.
Each menu item contains a variety of functions. From the Portfolio menu, for example, you can save and export your portfolio. The Metrics menu allows you to add and remove data columns. The View menu offers a selection of Beta weighting reference indices.
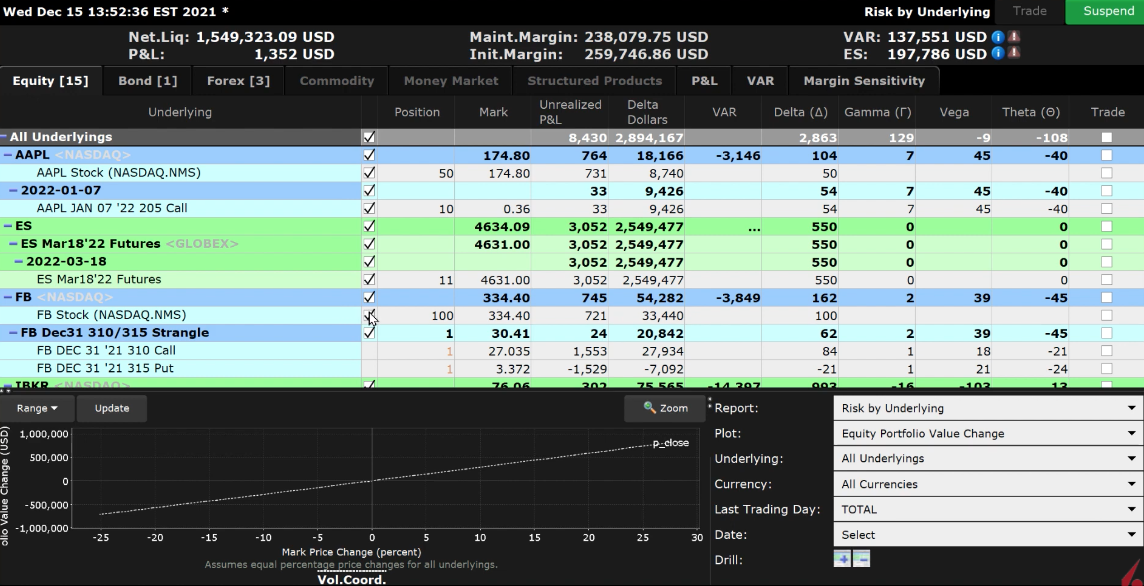
Directly below is the Risk Dashboard, here you’ll see important information on account metrics. Shown are net liquidity, P&L, maintenance margin, initial margin, value at risk, expected shortfall, portfolio Beta, and Average Beta. Later in the lessons we’ll show how you can see the effects of theoretical portfolio changes on some of these values shown in the Risk Navigator.
Continuing down is the tab set.
Click on the tab that corresponds with the asset class or information set you want to see. Equity includes stocks, options. Futures, and future options positions would appear in the Commodities tab.
Each tab will allow you to drill down into the specific instrument and measure potential risk and rewards from market movements.
The information sets include P&L, Value at Risk, Margin Sensitivity, and Margin Scenarios. Click on any of the tabs to see the contribution different asset classes, currency groups, or instruments are contributing to the set.
Underneath the tabs is the Report Viewer.
Each tab has its own unique report viewer, and they can be customized to show the data that is most important to you.
The tabs operate independently from each other so adding and removing data columns to one will not affect the others.
The Report viewer allows you to drill down and isolate individual assets as well as see results from different market scenarios on the price of the instruments.
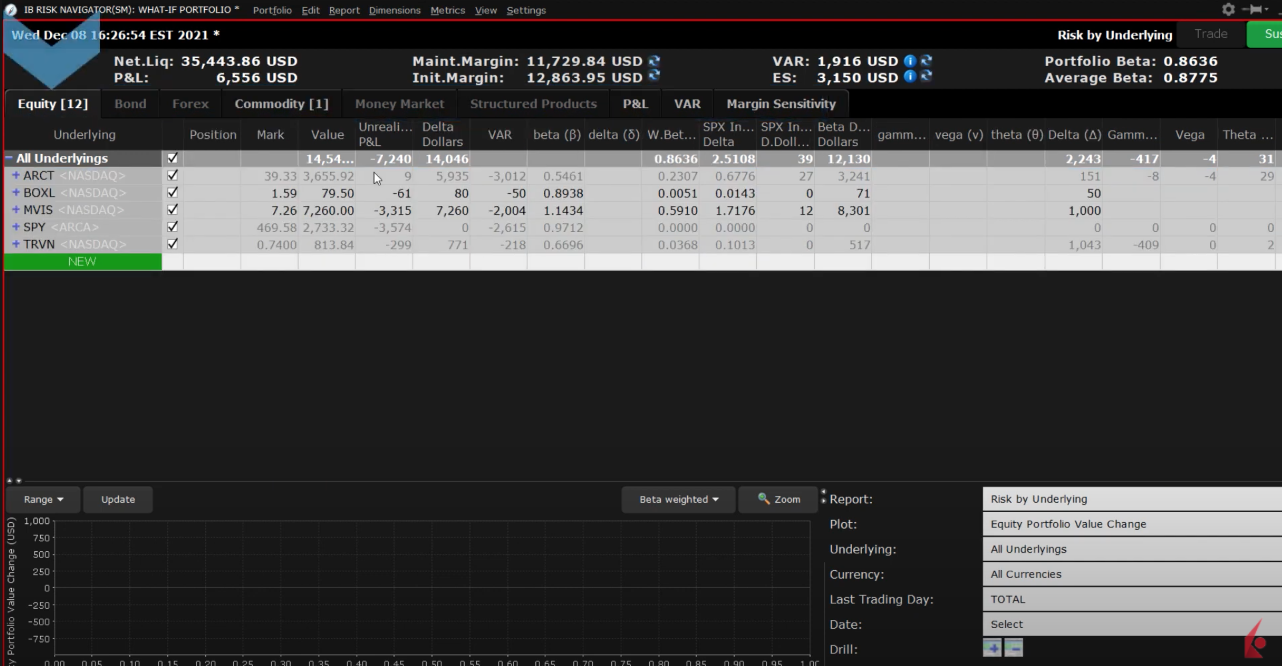
In the lower left-hand corner is the Plot Viewer, which graphically displays Portfolio P&L. The graph illustrates the changing value of your portfolio or selected instruments based on market changes. You can select the range you’re looking at as well as zoom in. The portfolio graph and the report viewer will show changes reflecting from the Report Selector located in the bottom right-hand corner.
The Report Selector controls the data displayed on both the Report Viewer and the Plot Viewer. You can choose how to display data or narrow it down to a single currency or underlying. Choose an expiration cut-off or a date. The Report Selector also can change the plot between portfolio value or value change, delta, unrealized P&L.
During this course we will go over many of the ways you can use the Risk Navigator to monitor your portfolio and see the potential effects market forces may have on existing or theoretical positions.
My risk profile chart keeps on disappearing every time I log out and log in again. How do I stop this?
Hi Denis, thank you for reaching out. We take comments like yours seriously and want to resolve this issue quickly. Please send an email to social@ibkr.com with a little more detail about what happened and we will respond ASAP.
thanks
Thanks for engaging!
I cannot find the risk analyzer on the mobile app. I’ve never used the browser version. Is that the only place this is available?
Hello Anonymous, we appreciate your question. At this time, Risk Navigator is only available in Trader Workstation.