


Study Notes:
In this lesson, we will review how to create Mosaic Market Scanners in TWS to scan the specified markets and return a list of contracts based on the defined criteria.
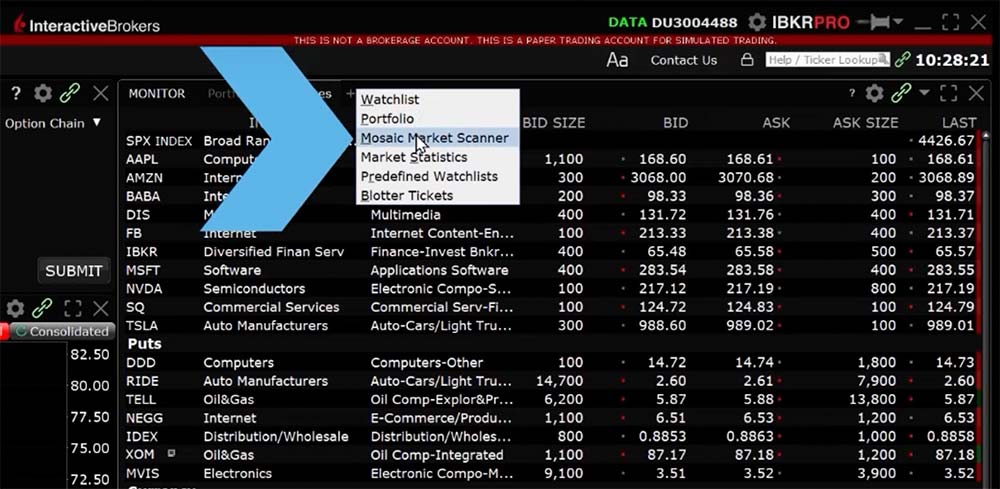
Mosaic Market Scanners can be launched from either Mosaic or Classic TWS. From Classic TWS, select Analytical Tools in the top left, scroll down to the “Technical” section, and click Mosaic Market Scanner. There are two ways to create a market scanner in Mosaic. The first method is click New Window, scroll down to the “General” area and highlight “scanners,” then select Mosaic Market Scanners. The second method is within the Monitor Panel, click on the plus sign at the top right of the panel and select Mosaic Market Scanner from the drop down.
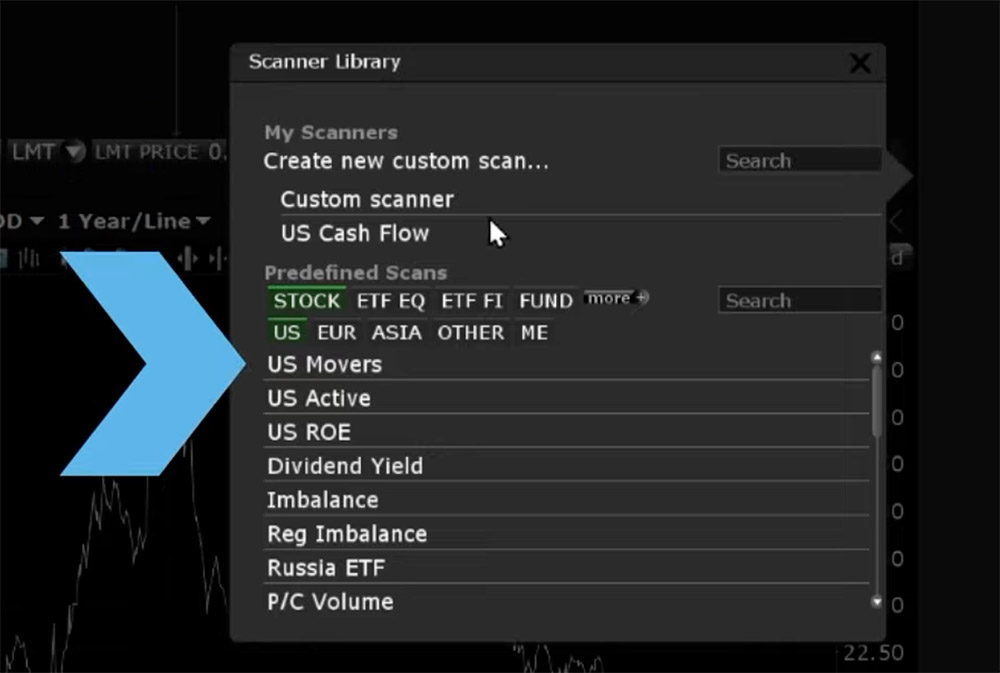
 A new tab will open in the Monitor Panel and a sidecar window will appear with your Scanner Library. You can open scans you had previously configured or open one of the predefined scans, such as US Movers or Dividend Yield. Use the filters to specify the region or asset to view scanners only meeting the criteria.
 For example, to view predefined scans for European Indexes, click the More tab to view the full list of available assets and check the box next to Indexes. Then, select EUR for European markets and the list of available predefined scanners based on the specified criteria will be displayed, in this case European Index Movers.
Click on the scan in the Scanner Library and it will populate in the Monitor Panel. To change any parameters for the existing scanner, click the green Edit Scanner button in the top right and the sidecar window will open with the universe and filters.
You can also create a new scanner from scratch. Again, I will click on the plus sign in the Monitor Panel then select Mosaic Market Scanner. This time, I will click Create new custom scan…
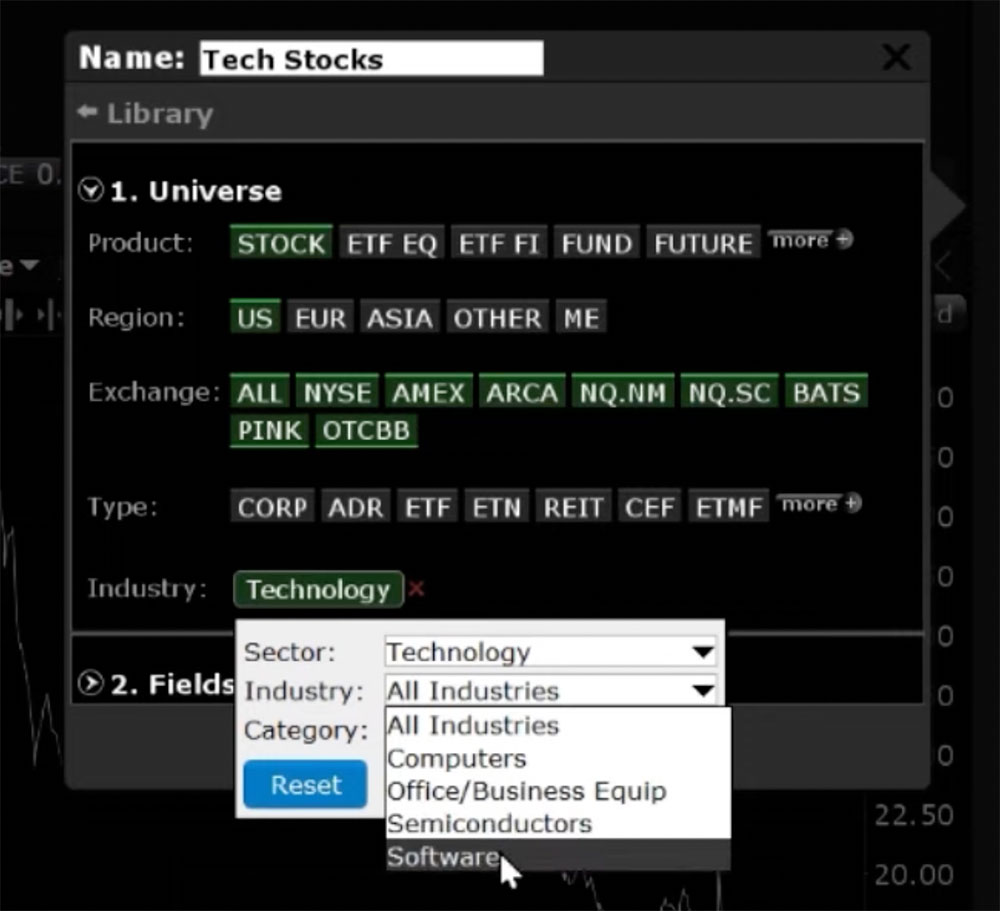
Enter a name for your scanner at the top of the sidecar window. I’ll title this scanner “Tech Stocks” and you can see the tab on the right adjusts to reflect the title. Every change made in the sidecar window is reflected in real-time in the scanner on the right side of the screen.
The sidecar is split into two main sections – the Universe and the Fields & Filters. The Universe will define the scan including the product(s), region(s), exchange(s), instrument type(s) and the optional industry filters. The Fields & Filters section allows you to manage the displayed data columns and sort or filter the results.
For this example, I will create a scanner for US Stocks and select all exchanges. I will also filter by Industry to just view Technology companies and more specifically just Software companies. Once the Industry parameters are selected, click Done.
 Now that our universe is defined, specify which fields are displayed and filter the results by clicking Fields & Filters. By default, the Financial Instrument, Last, Change and Change Percentage columns will be displayed. To add columns, click Add Fields towards the bottom left. Click to expand any of the categories or use the search bar at the top to quickly look for a particular field. For example, I will add the columns Earnings Per Share Growth Rate Percentage and Market Cap.
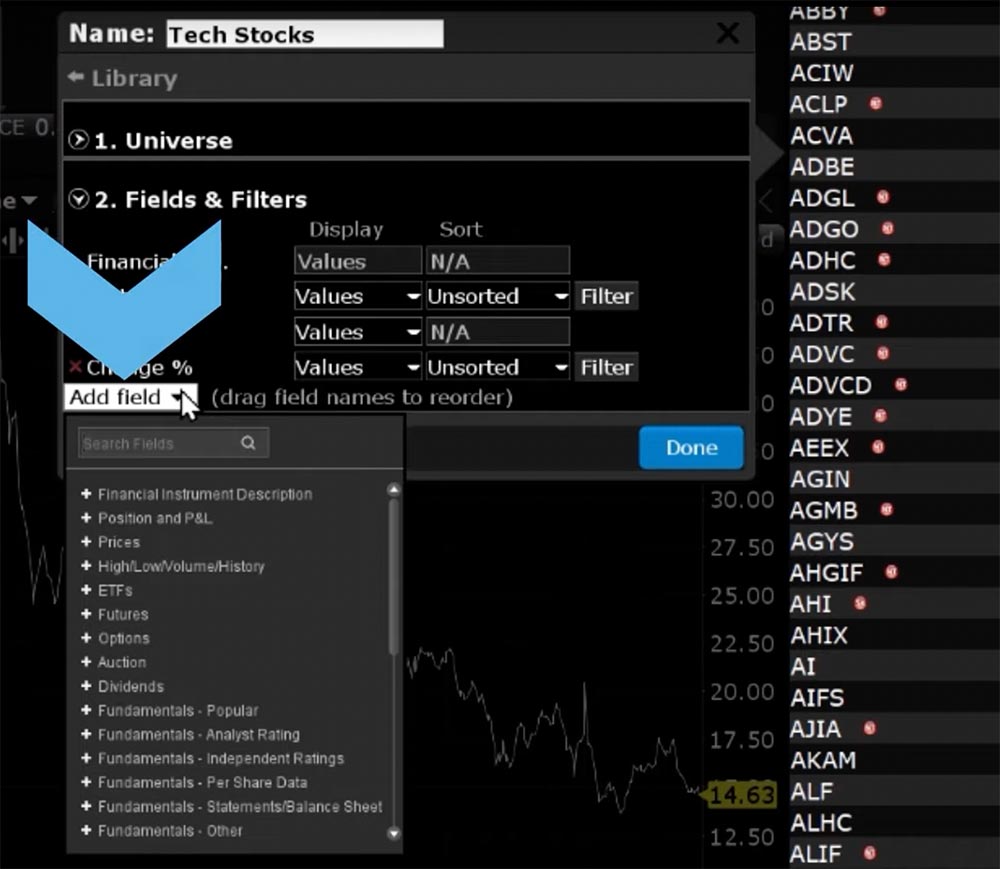 To delete a field, click the red X to the left of the field. For example, I will remove the Change Column. To change the display order of the fields, click on the field you would like to move and drag it to the desired order. I will select Change Percentage and drag it to the top and drop it before Last price.
It is also possible to change the ways the fields are displayed. Click the drop down to the right of the field to view the available display options.
Values will show the expected numerical value appropriate for the field which is the default display.
Gradient uses a filled, colored circle with different shades to provide information on the field value. Red shades identify a downward move and green shows upward movement. Hold your mouse over a gradient to see the color-shading key.
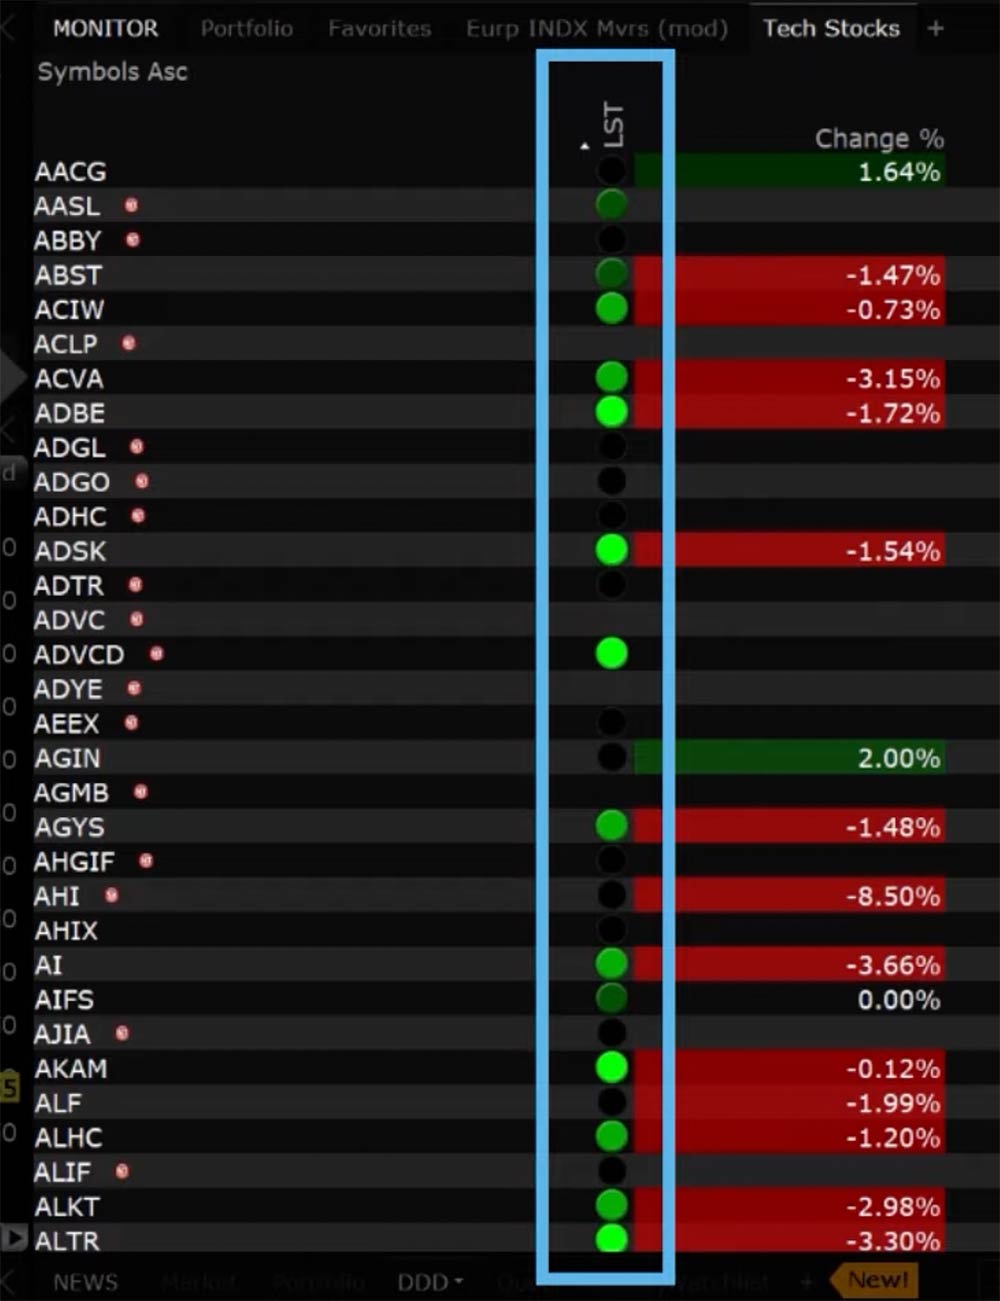 Bar displays the field value graphically using a colored bar chart to indicate the direction and degree of change. As with the Gradient display, red indicates negative and green indicates positive. The length of the bar indicates the degree of change (the value). Bars that have values outside the hand-picked range will display a very bright section at the end of the bar to signify values outside the range. Mouse over the bar to display the value for the financial instrument and the range of values across the scanner results.
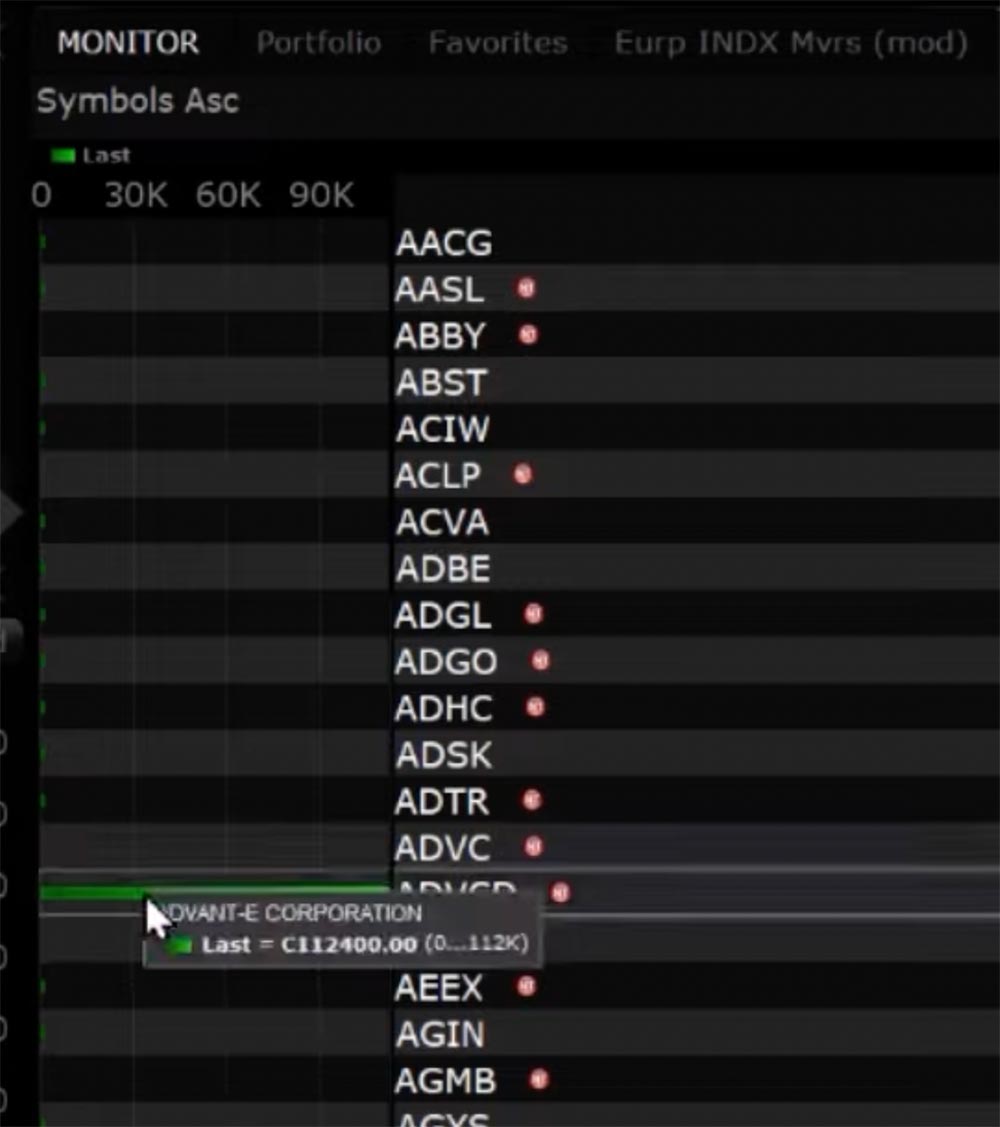 Line displays the field value graphically using a colored line chart. You can elect to view up to three fields that use the Line chart view. If line display is selected for multiple fields, a key of the line color and corresponding field is displayed in the top left corner of the scanner. Again, hold your mouse over the line points to display the value for the financial instrument and the range of values across the scanner results.
 Values + Gradient, Bar, or Line displays two fields for a single value: one with the numerical value and one with the color display of gradient, bar chart or line chart.
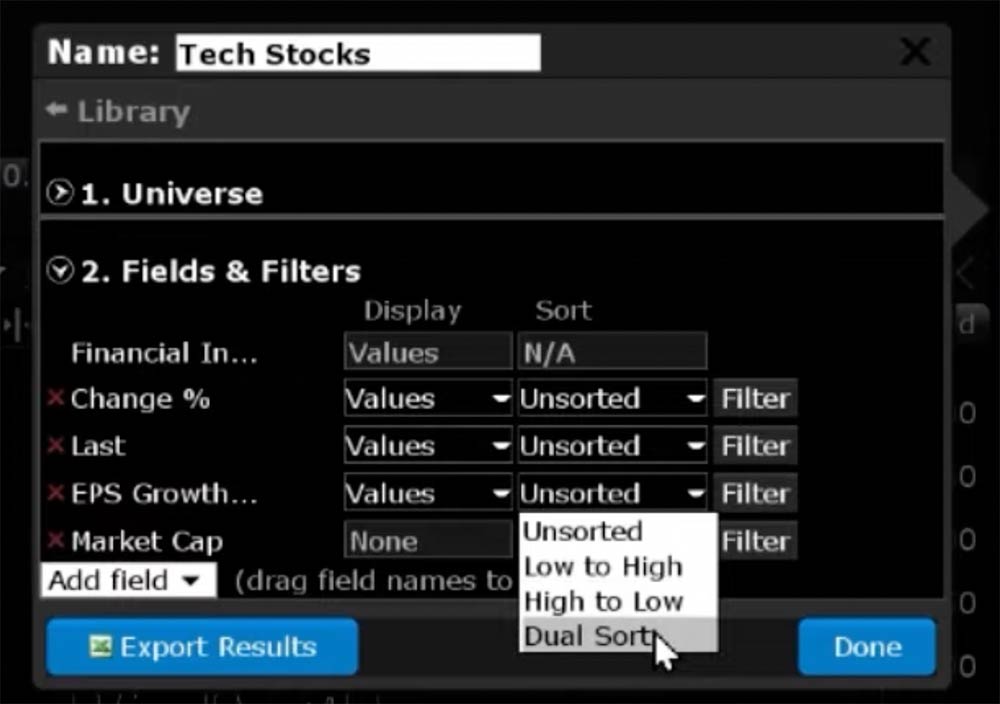
There are also numerous ways to sort the data that is displayed. Sort criteria can only be selected for one field. Click the Sort drop down to the right of the field you would like the scanner to be sorted by and select from Unsorted, Low to High, High to Low or Dual Sort. Dual Sort will show the scanner sorted in both directions on the selected field. For example, if I select Dual Sort for the EPS Growth Rate Percentage, the scanner will split the data into two sections and the data on the left is sorted in an ascending manner (Low to High) and the data on the right is descending sorted (High to Low).
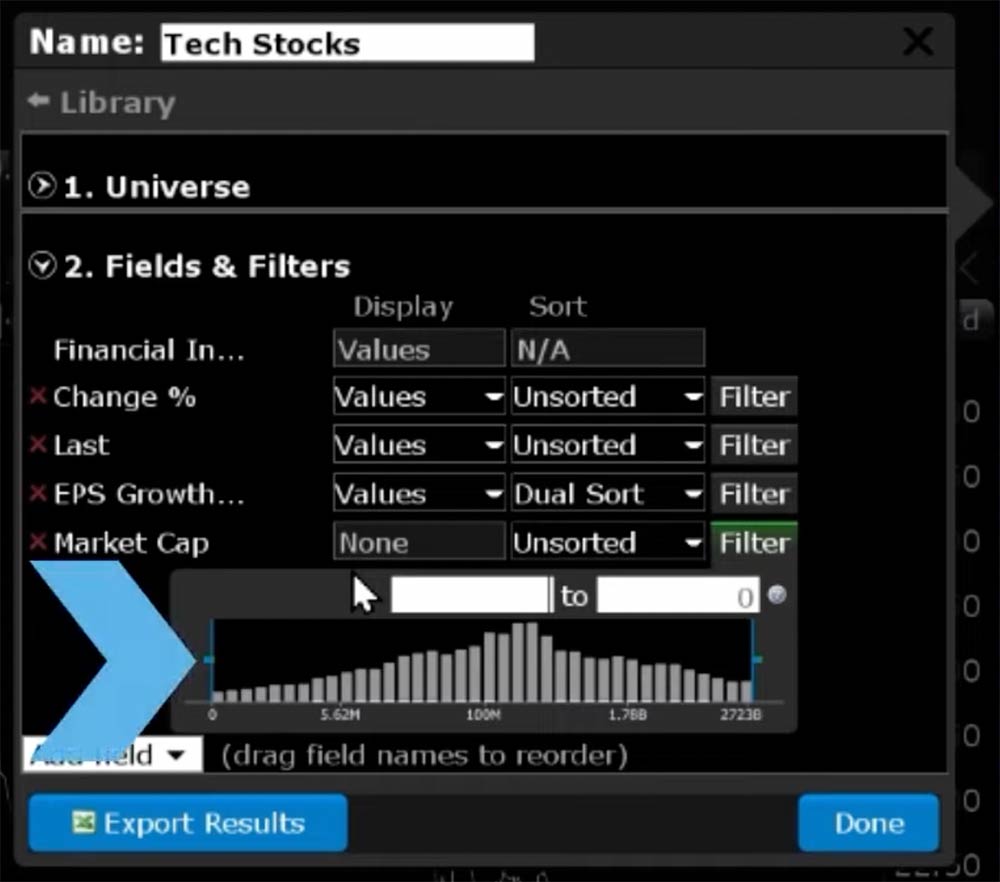
 You can also specify filter parameters for a given field. If it is available for the field, you will see a Filter button to the right of the field. Click Filter to set the parameters and type in the lower and upper bounds. Alternatively, you can click and drag the blue lines on the graph to set the filter bounds instead of typing the bounds. For example, I will select to filter the Market Cap field for companies with a market capitalization between $15 billion and $90 billion.
 If you are satisfied with the scanner parameters and you would like to export the data to a static Excel file, click Export Results in the bottom left corner of the sidecar window. A popup window will open to allow you to specify where the file will be saved and the file name. When you are ready, click save and you will receive a confirmation message indicating the export has been completed.
If you would like to edit the parameters of the custom scanner at any time, click Edit Scanner in the top right corner of the scanner results in the Monitor Panel and the sidecar window will open.
As we’ve reviewed in this video, the Mosaic Market Scanner is a powerful tool that allows you to create a list of financial instruments based on specified markets and criteria.
Hi
Is it possible to create a custom field / modify an existing field in the scanner? For example, I want to use 8 EMA and 21 EMA as indicators and run a search for stocks that are trading where 8 EMA > 21 EMA as a bullish indicator.?
Hi Charles, we appreciate your question. You can create an entirely new custom scanner (https://www.ibkrguides.com/tws/usersguidebook/mosaic/mosaic%20market%20scanners.htm?Highlight=custom%20scanner%20field) or create one based on a predefined Mosaic market scanner (https://www.ibkrguides.com/tws/usersguidebook/mosaic/predefined%20mosaic%20market%20scanners.htm). We hope this helps! Let us know if you have more questions.
Hi,
When I specify filter parameters, it doesn’t seem to save them and will only apply one filter at a time, is there a way to save these filter parameters to have multiple set at the same time?
Also, it will only display 50 shares at one time, is there is way to increase the maximum amount of results?
Thank you.
Hi Daniel, thank you for your questions. Multiple filters can be applied at same time; however, you can only select one sorting method. We don’t support say sort by % change, then volume, then option open interest, but you can apply filters – e.g., %change > 1%, volume > 10M, open interest > 5k should produce results. If you are looking to add multiple types of industries and categories within the Universe, you can only set one, and then you would have to delete that one to set another. For your second inquiry, that is a Mosaic scanner limitation, but an Advanced scanner allows more, and the same scans and filters should be available. We hope this helps!
monitor only shows first page of search can i ask if it is possible to export all pages ?
Hello, thank you for reaching out. If you are satisfied with the scanner parameters and you would like to export the data to a static Excel file, click Export Results in the bottom left corner of the sidecar window. A popup window will open to allow you to specify where the file will be saved and the file name. When you are ready, click save and you will receive a confirmation message indicating the export has been completed. We hope this helps!
When I use the scanner for technical analysis it works ok but only includes up to the closing on the previous day. I called support but they could not give me an answer on why the current day is not included as I have subscribed to real-time data and quotes and charts are in real time.. As a new day trader I need real-time analysis of technical such as flag patterns, etc. in real-time. They are looking into this and I am waiting for a response. Anybody have a suggested solution?
Hello, thank you for reaching out and please accept our apologies. At this time, the market scanners do not have this functionality.