


")


Study Notes:
The Performance Profile is available for stock and options for you to consider potential profit and loss values through and at expiration. The chart displays a solid line for at expiration values and a dotted line depicting p/l using the as-of date determined using the date selector.
How to Access
The Performance Profile is available from several locations:
- From the New Window button locate and expand Option Analysis and select the Performance Profile. The software will populate with the active ticker – the one you last interacted with.
- From within the Strategy Builder as you are creating a combination locate and click the Performance Profile button to evaluate the trade you are building.
- If you have a simple option position or a multi-legged combination in a Watchlist or your Portfolio window, you can right click on the position or symbol row, look for Analytical Tools and open the window by selecting Performance Profile.
Let’s walk through the three areas displayed in Performance Profile. For this example, we’ll use a simple long call option position.
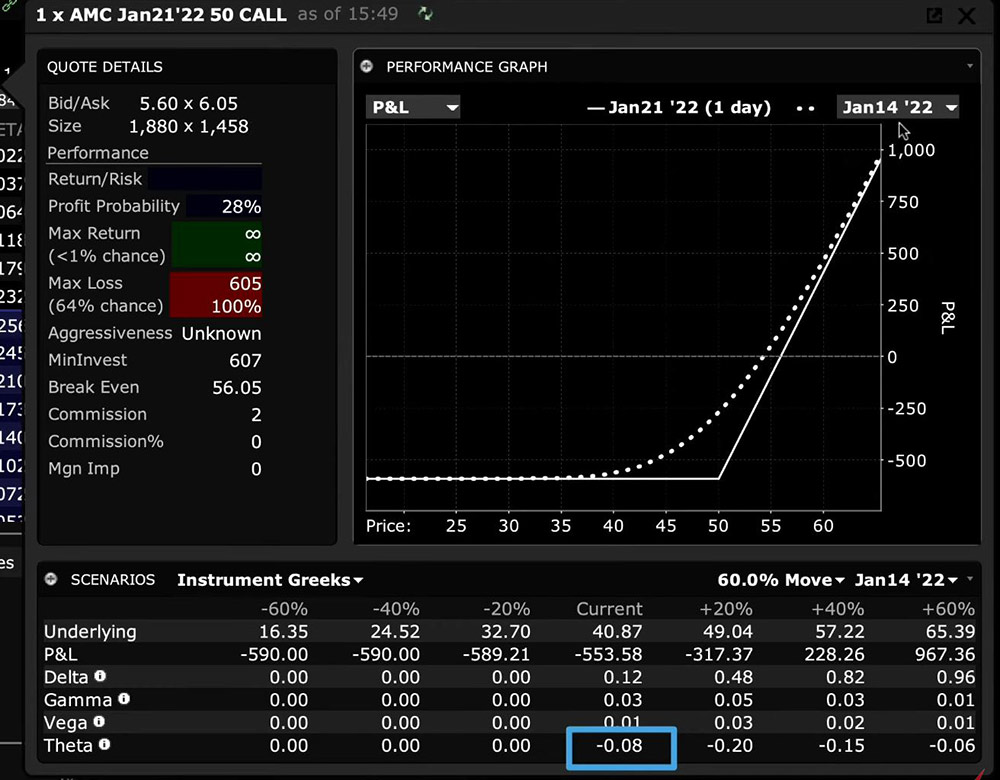
Quote Details – The Quote Details area shows market metrics and defines the potential risk and rewards associated with placing this trade. The trade specifics are shown to the upper left. And the option quote is displayed beneath. Add the premium to the strike price and you can determine the Break Even value displayed below.
The Profit Probability is ranked in percentage terms and is a function of the number of days to expiration and how far the strike price is away from the price of the underlying.
The Maximum Return from a long call is infinite, since the price of the stock could go up and up and up. Remember, the downside risk for any stock is always to zero but is not infinite. The Maximum Loss from buying a call is defined as the premium paid.
An option buyer can only ever lose the amount of premium, plus any associated commissions, but that is all. The minimum investment is calculated by multiplying the premium paid for the call option by 100 shares + commission. You’ll also see the Margin Impact of buying the call option.
Scenario Panel – The Scenario Panel allows you to perform a scenario analysis allowing for changes in the price of the underlying and change in time. Note the two dropdown menus to the right of this panel. You can vary the size of the price move shown in the chart between 5-100%.
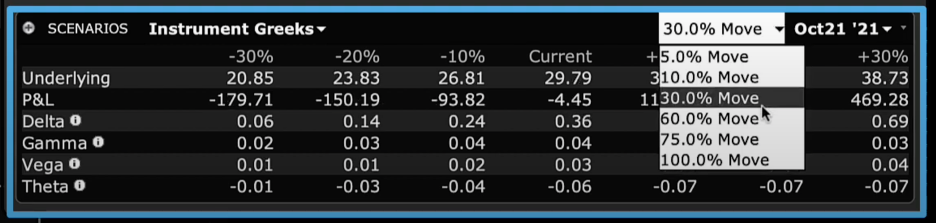
That will change the display on the Performance Graph above and the matrix in the Scenario Panel. Second, you can change the date through expiration. If you loaded an option combination with two different dates, such as a calendar spread, you will be able to choose through the first of those expiration dates.
See the current price of the underlying and calculates up and down changes for the underlying according to the percentage movement you choose from the dropdown. The associated P/L is displayed on the second row for each price change. Now, when you step through time by selecting a different date using the calendar dropdown menu, you will see P/L and other matrix values vary.
Performance Graph – The Performance Graph allows you to visualize and compare one day at a time versus the expiration date for several variables. The solid white line is the expiration view, while the dotted line always represents the date chosen from the calendar dropdown menu in the upper right corner. By default, you are looking at P/L. Select from the list of P/L and Greek variables from the selector to the upper left of the Performance Graph. For greater granularity, you may want to reduce the price range in the Scenarios panel to a smaller value.
Change the date to see how P/L or the Greek variables shift towards expiration.
Hover your cursor over the dotted line to see associated P/L or other variables as selected from the dropdown menu.
Practical Use
Use one symbol with two expirations to exemplify this concept.
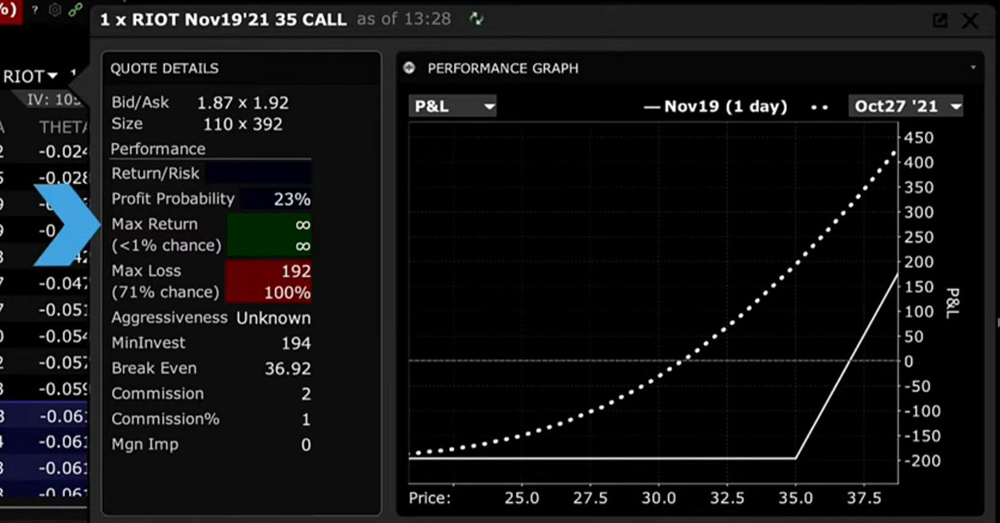
Example 1. Risk and Chance of Profit – To illustrate the chances of potential profitability, let’s take this stock XYZ and highlight side-by-side the Probability of Profit.
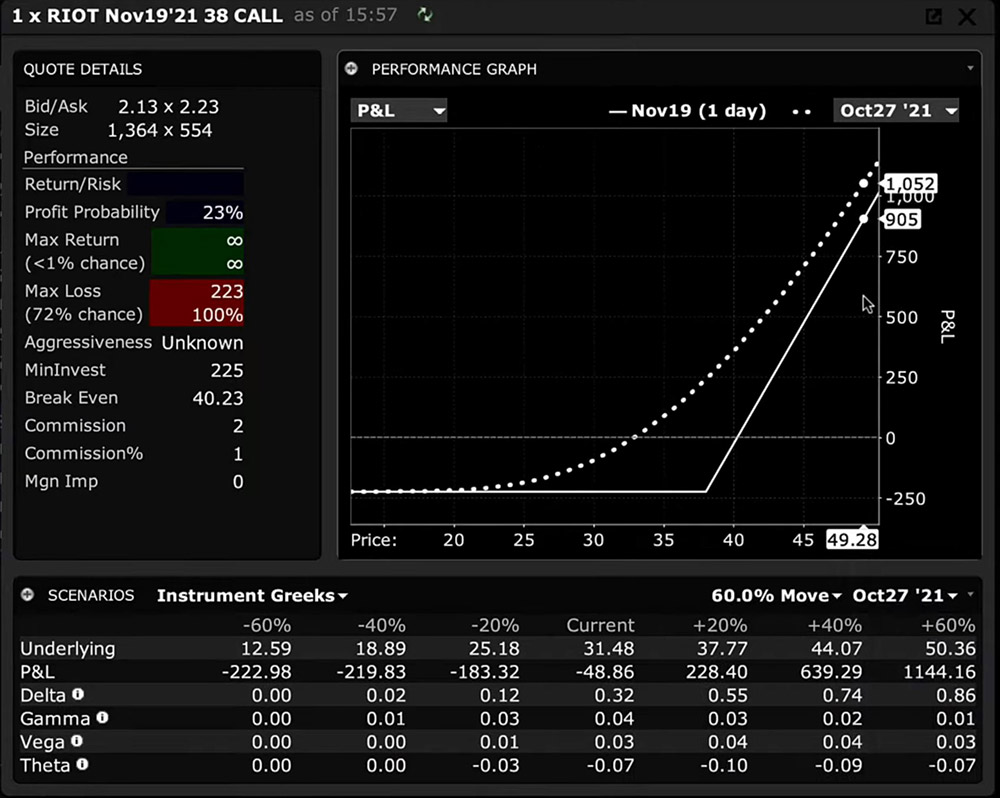
With the underlying trading at $40 by selecting a $50 strike price at different expirations, you can see that for the option with the shortest expiration date, the Probability of Profit is less than the Probability of Profit when the option has longer to run. This can be a useful feature to focus on when considering the potential for gains and losses at far out-of-the-money call and put options.
Example 2. Decay of an Option – To illustrate how time decays the premium of an option, you can view the value of Theta or the rate of change in the premium for each day closer the contract is to expiration. Reading from the matrix (and mark on the plot) this out-the-money 90-day contract currently displays a Theta value of -0.05. That means that, should the price of the underlying remain static overnight, the premium should lose approximately 5-cents by tomorrow. Notice too that Theta is greater at higher prices.
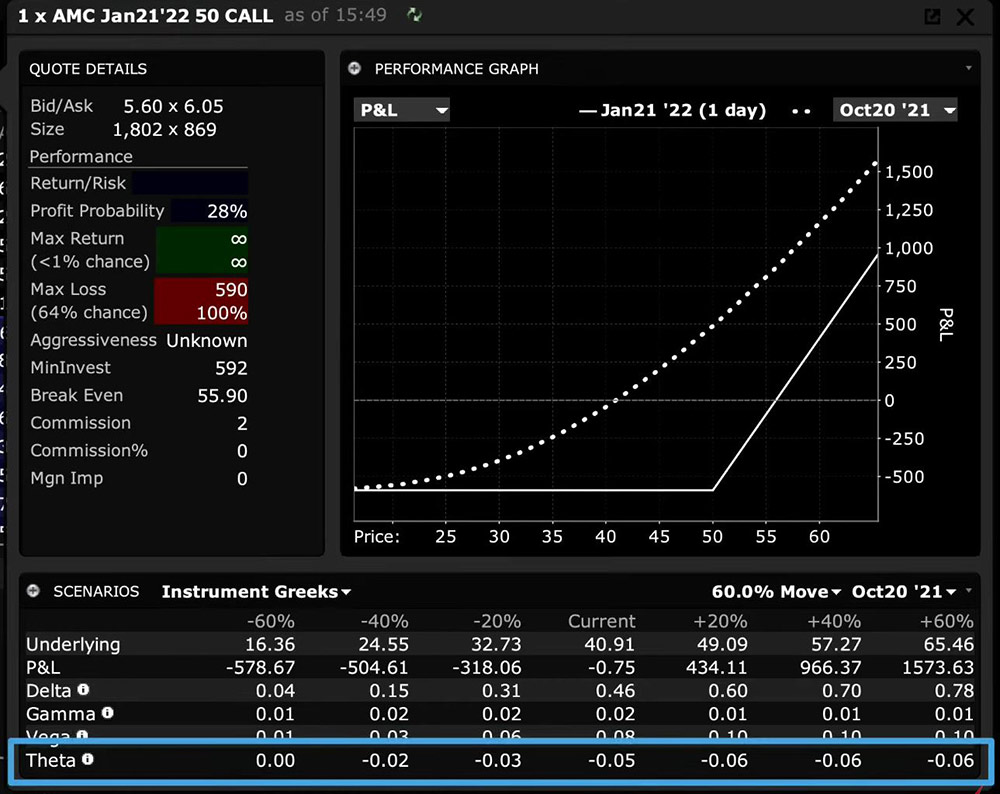
Now, fast forward to one week prior to option expiration to show that Theta at the current price is -0.08 or 8 cents, and that should price increase Theta or the rate at which the option decays is greater.
This is valuable information for an option trader from the perspective of both buyer and seller. A buyer needs to be aware of how quickly the premium is eroding if the option is still out-of-the-money towards expiration. If bought for protective purchases, the buyer might consider rolling to a further maturity. An option seller might want to know which option to write to maximize time decay for out-the-money options.
The Performance Profile is a valuable tool when evaluating trades. Explore by understanding the Risk metrics and remember to change both the date and variable on display to fully understand potential scenarios.
Additional Links
Join The Conversation
If you have a general question, it may already be covered in our FAQs. If you have an account-specific question or concern, please reach out to Client Services.