


Study Notes:
The Risk Navigator P&L Summary and Value at Risk or VAR tabs can be extremely useful in determining the current Profit and Loss as well as the expected loss under normal market conditions. Let us start with the P&L Summary tab.
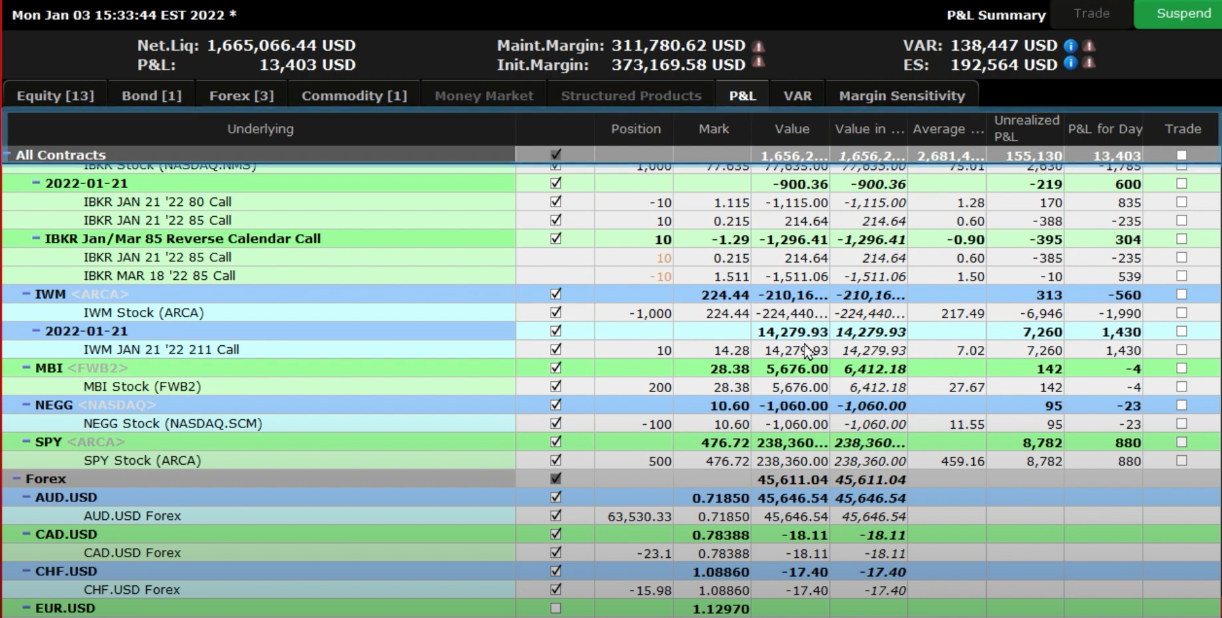
The P&L Summary report displays profit and loss values for all contracts in your portfolio. The display is sorted by asset type and includes the total P&L for your portfolio, totals by asset class, and the current P&L for each asset. Like many other Trader Workstation Tools data columns can be added and omitted to customize the view. To see the columns available for the Report Viewer area, go to the title bar and click on “Metrics” and choose columns from the following column areas: Position size, Value, Price, Descriptive Columns, Trade Column, and whether to have the option include specific positions. Highlight any one of them and choose the columns you would like to display. Once you have the desired data columns in the Report Viewer you can look at the values for each position. Like several other tools in Trader Workstation, you can hover your cursor over the Column header and see a definition for the column. This is extremely helpful in understanding the values in each column and how they are derived.
Clicking the plus sign on the bottom right corner expands the Report viewer to show all instruments under their asset class header.
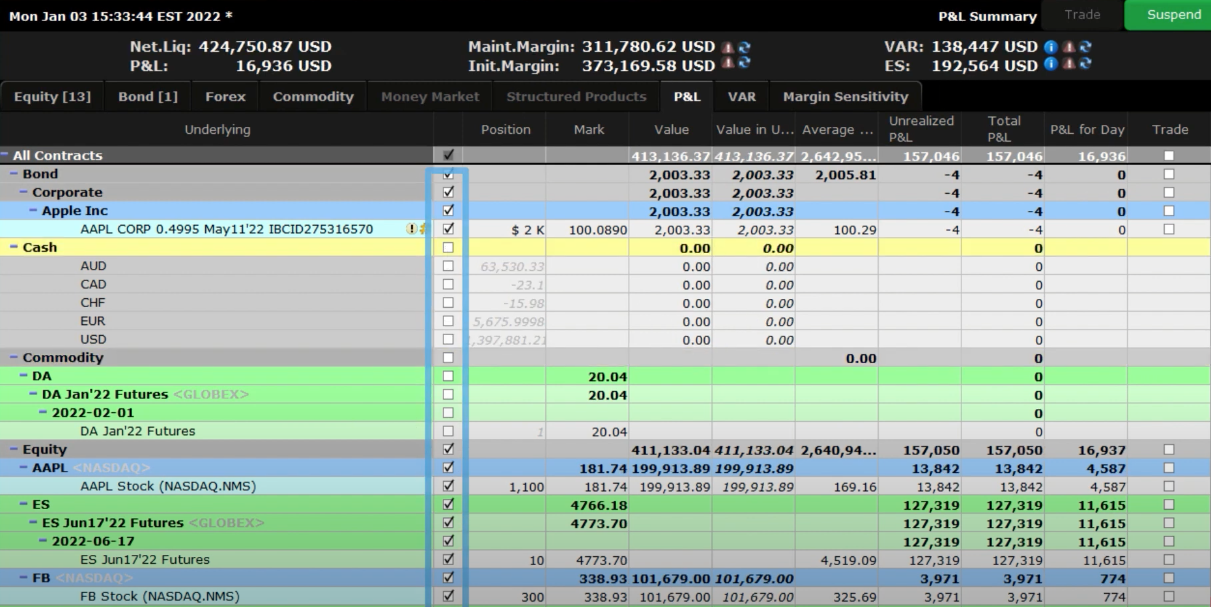
In this viewer we have Bonds, Cash, Commodities, Equity – which includes options, and Forex. You can narrow down the list by currency or a single underlying. You can omit asset classes or individual positions by clicking on the white box next to the contract description. If you do not see the white box, go into Metrics and click on “Include Positions.” As you exclude or include different positions, you will see the total values at the top change to reflect the positions they are reading. As you include and exclude positions you can see the effect on the Margins, VAR, and Expected Shortfall.
The P&L tab is clear and uncomplicated way to see real-time unrealized P&L, Average costs, and other important financial information for your entire portfolio or individual positions.
We will now look at the VAR or Value at Risk tab which is located to the right of the P&L tab. The Value at Risk represents the expected loss under normal market conditions, over a specific time horizon and based on the percent probability as defined by the confidence level.
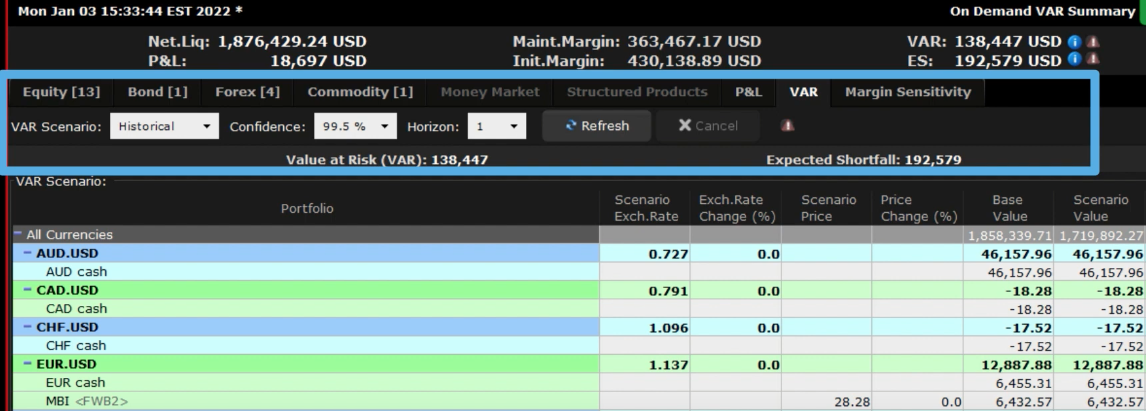
This is a theoretical value and does not represent the potential worst-case loss scenario. The On-Demand VAR report calculates Value at Risk for the entire portfolio. The report calculates the VAR at the sub-portfolio level and aggregates it at the currency and portfolio levels. On Demand VAR is also available for What-If hypothetical portfolios.
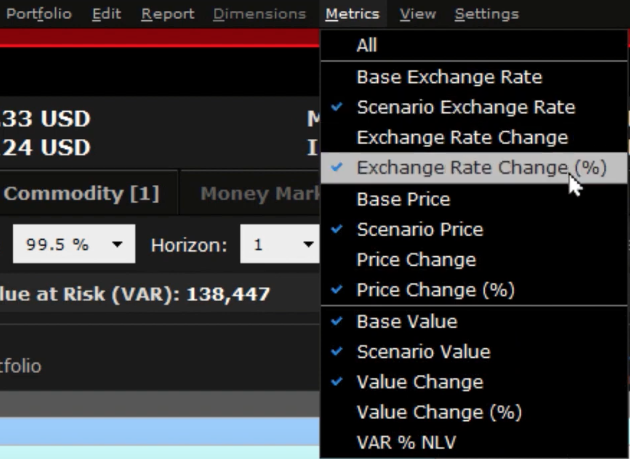
We will go through the different settings in the Value at Risk tab and examine what they do. The columns can be adjusted by going to the title bar and selecting, “Metrics.” The Available columns are Base Exchange Rate, Scenario Exchange Rate, Exchange Rate Change, Exchange Rate Change %, Base Price, Scenario Price, Price Change, Price Change %, Base Value, Scenario Value, Value Change, Value Change %, and VAR % of NLV. As with the P&L tab if you hold your mouse over the column names inside the report it will give you a definition of the column values.
Starting from the left, choose between historical or Monte Carlo to use for the VAR scenario. Historical will use past data to estimate prices and Monte Carlo uses a model for price estimation. Once you decide which method to use choose a confidence level assumption of between 99%, 99.5%, or 99.9%. The confidence level is the percentage of the time your losses will be lower than the VAR number. So, for example, if the VAR number calculated is $2.5 million and you set the confidence to 99.5, 0.5% of the the time your losses will be greater and 99.5% of the time the losses will be less. Continuing right is the Horizon drop-down. Set the period to 1,2,3 or 4 days. Whenever you want to see the results updated for your choices click the “Refresh” button.
Let us expand the report to show each position under the relevant currency by clicking the plus sign in the lower right-hand corner. We will now walk through changing the VAR scenarios and seeing the effects it has. Prior to starting, go to the Metrics title bar and select “All” to display each of the available columns.
We’ll start with using a Historical Scenario, with a 99% confidence for 1 day horizon. Look at the difference between the base price of each instrument and the scenario price, as well as the difference between the base value and the Scenario value.
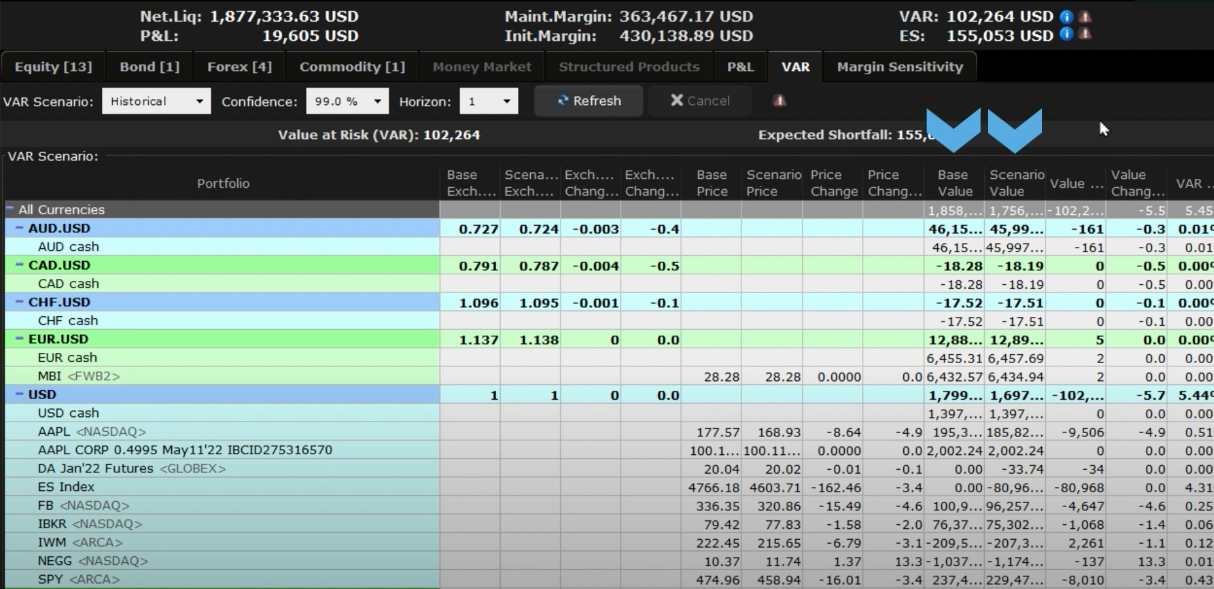
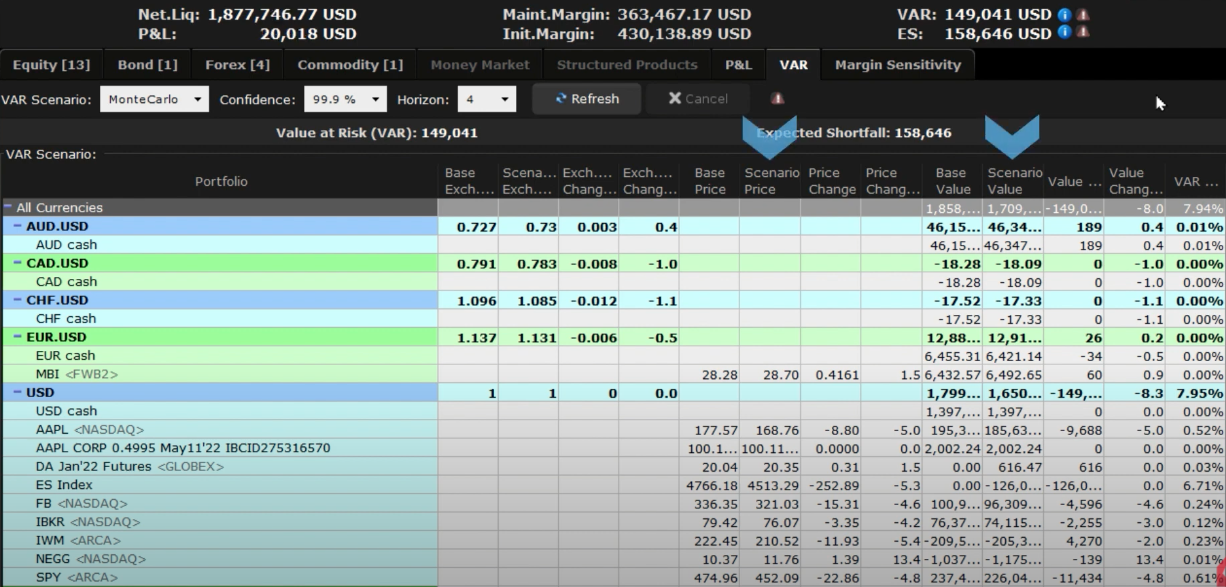
You can see the total Value at Risk at the top as well as the Expected Shortfall. Make a note of the values and we will now adjust the settings. We will keep the scenario as Historic but change the confidence interval level to 99.9% and leave the horizon at 1 and then click Refresh. The VAR and expected shortfall have increased significantly due to increasing the confidence level. Now adjust the horizon to 4 while leaving the VAR Scenario at Historical and the Confidence at 99.9%. Click Refresh. Once again, the VAR and Expected shortfall have increased significantly since this time we have expanded the time horizon.
Finally, change the VAR Scenario from Historical to Monte Carlo, while leaving Confidence and Horizon at their current settings. Click Refresh and the VAR and Expected Shortfall again change dramatically, since we are using a different VAR Scenario.
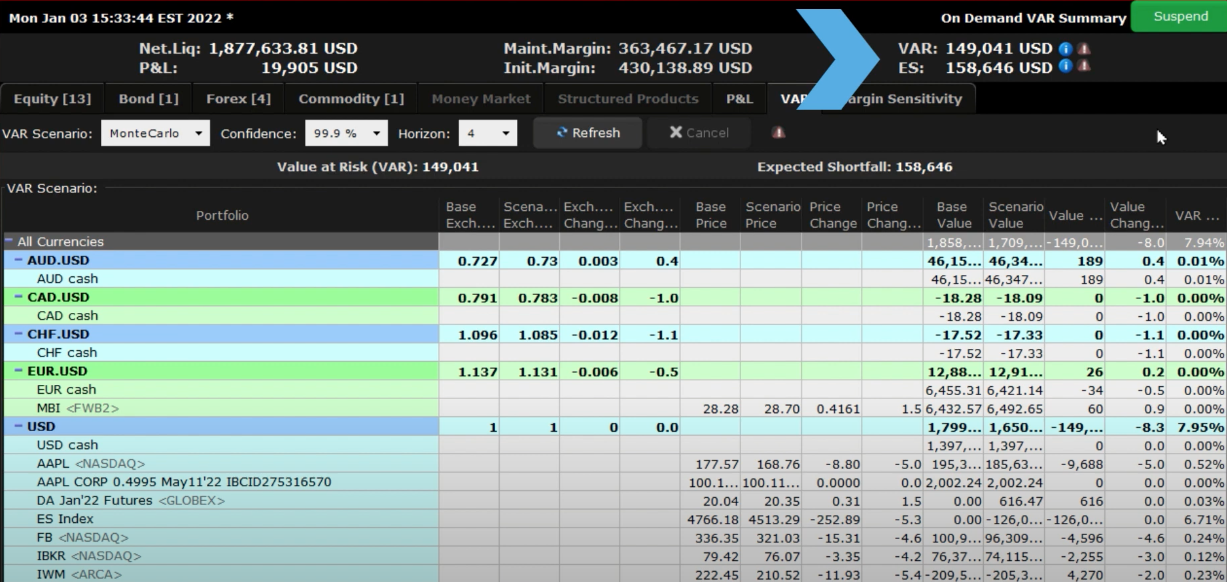
Throughout making changes you can see the specific effects on each instrument by looking at the Scenario Price or Scenario value columns to locate the biggest contributors in your portfolio to the Value at Risk.
Both the Risk Navigator P&L and VAR tabs are valuable tools in helping you determine the profit and loss and value at risk in your actual or hypothetical portfolios. Along with the other Risk Navigator tabs they provide a comprehensive measure of risk across multiple asset classes around the globe in your portfolio.
Join The Conversation
If you have a general question, it may already be covered in our FAQs. If you have an account-specific question or concern, please reach out to Client Services.