


Study Notes:
In this lesson we will look at the Risk Navigator Plot Viewer and Report Selector to help view your portfolio or isolate and view specific positions within your portfolio. The Plot Viewer enables you to see the impact on P/L from both a move in the underlying or in the overall market.
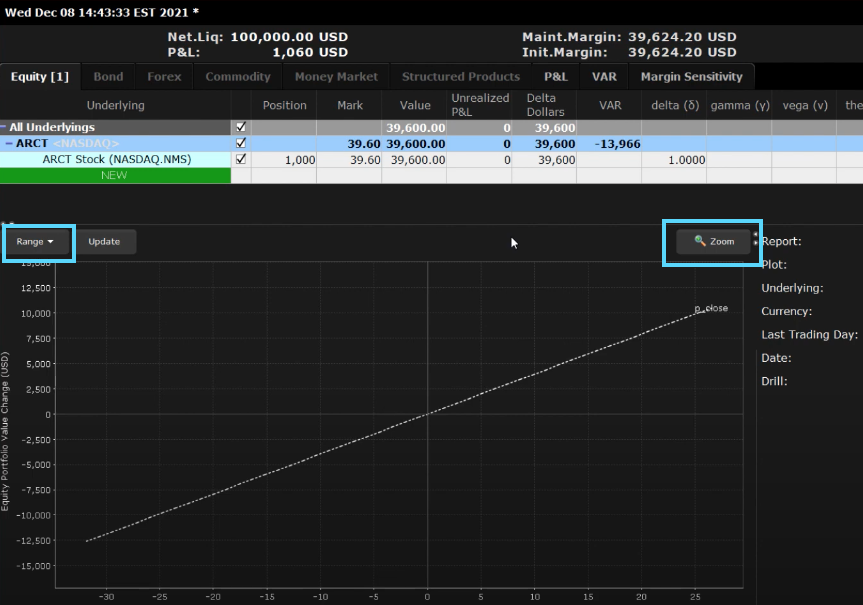
The Report Selector drives the display of the Plot Viewer. Note that you can resize the Plot Viewer both horizontally and vertically by simply dragging the lines or using the max/min arrows shown here.
For the purposes of this lesson, we will build a what-if portfolio. Use the Portfolio dropdown menu, select New and, when asked whether to add your existing positions, click No. This will allow us to work with a clean slate and build up into positions and display them using the Plot Viewer. The red line bordering this new Risk Navigator window indicates that you are now working within a what-if or dummy environment.
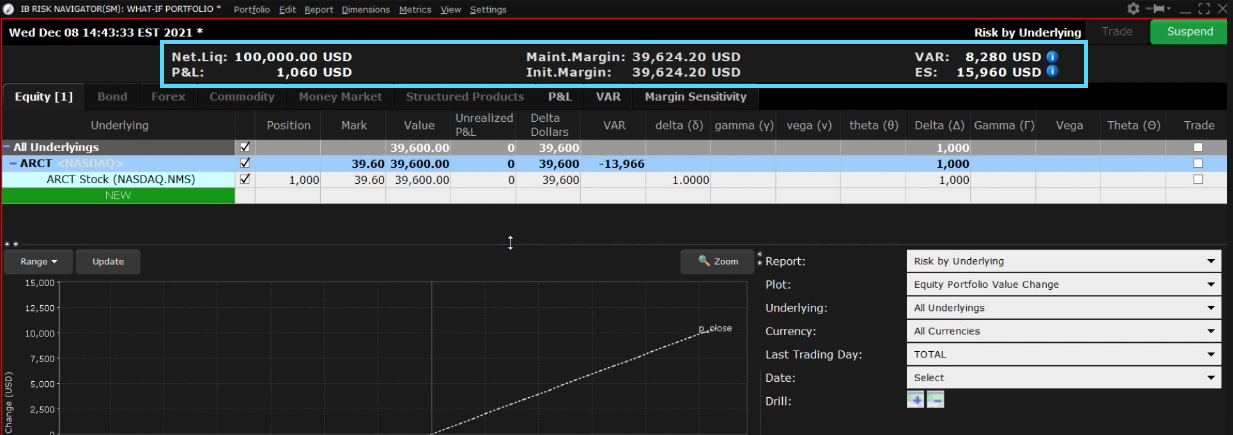
The first thing I will do is to add $100,000 cash to this portfolio from the P&L tab. Hit enter and see how the Net Liquidation Value (to the upper left on the dashboard) reports the worth of this portfolio. Let’s start by adding a single ticker to the underlying positions on the Equity tab.
Click the green NEW button and enter a symbol. In the position column enter the number of shares and hit enter. Notice that while the net liquidation value remains relatively unchanged, you will see initial and maintenance margin values populate in the dashboard at the top of the screen.
Before adding another position, let’s review the plot beneath. By default, the plot displays the Equity Portfolio Value change on the left axis, against the change in the market along the bottom. For a long stock position, and for a portfolio of long stocks in general, the plot will display an upwards sloping 45-degree line. This indicates the linear relationship between stock prices and P&L. Right-click anywhere on the Plot Viewer and select Vertical Crosshairs towards the bottom of the pop-up menu. Move your cursor along the white-dashed line to read off P&L values associated with a movement in the market. Be aware that P&L is reported in real-time and that you can click the Update button to refresh the screen.
Let’s add another long stock position by following the same process. Click the green NEW button to start. This time when you enter the position size, notice that the initial and maintenance margin values did not yet change. However, there is now a blue/green swirl to the right of each value. That’s important and indicates that you must refresh the values by clicking on the swirl. Click to see updated margin requirements.
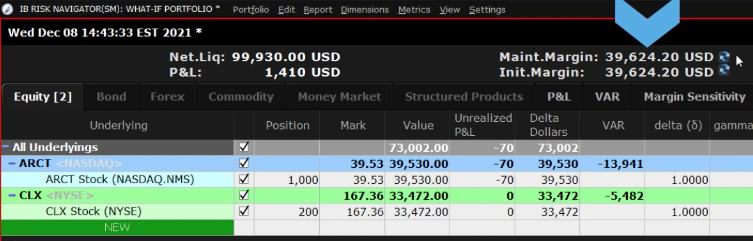
Taking on additional positions should increase margin values. By how much depends on several factors including your account type and concentration of holdings, market cap, liquidity of the stock and several other factors.
In the Plot Viewer you will not see much change. We still have the same upwards sloping line. But as you run your cursor over the dashed white line, you should see greater sensitivity in P&L as the market moves. That is, for a 10% upwards shift in the market, your positions should be making more money. Conversely, for a given 10% lurch lower in the broad market, your losses may be greater.
To isolate a single position, look at the Report Selector and from the Underlying menu click the dropdown menu to reveal the underlying position symbols. Before selecting one of the positions, you can see from the Plot Viewer that the lower axis measures the percentage change in the broad market. But when you select an underlying, you can now isolate the share price or else the percentage change in the share price.
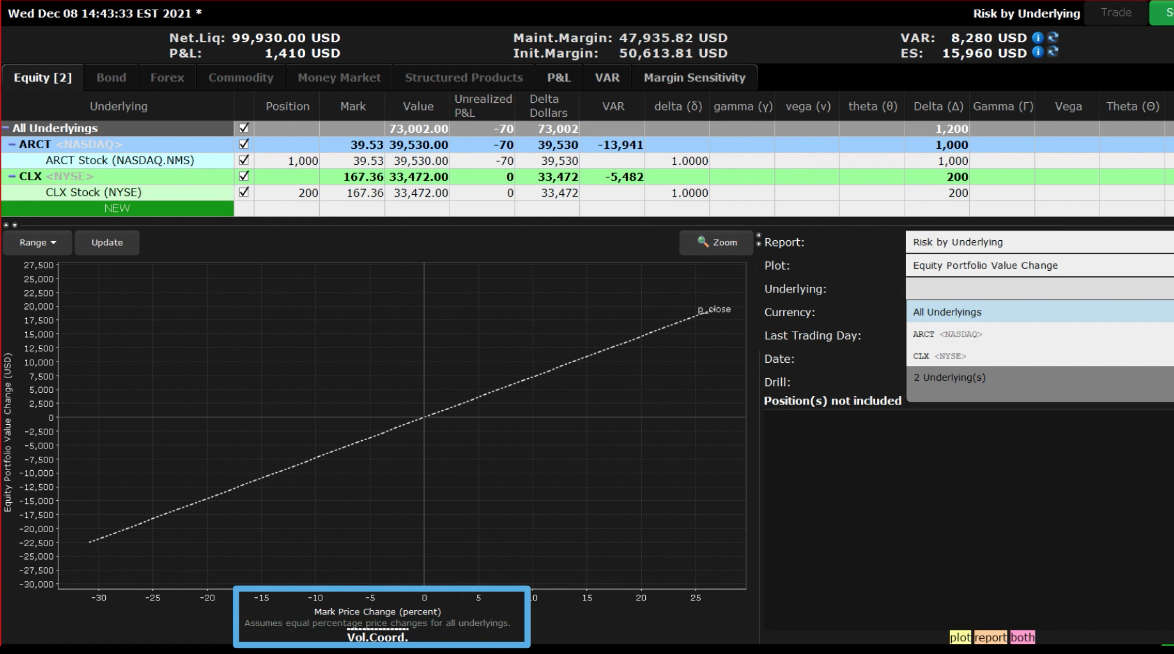
You can do this by clicking the arrow to the right of the box below the chart stating Underlying Price for the selected symbol. Now you can hover your cursor above the share price for the chosen underlying and read off the P&L at a specific value. It is not possible to look at share price when you are looking at more than one underlying, which is why the lower axis is displayed using a benchmark. Note that you can change the selected benchmark by accessing the Settings dropdown menu at the top of the page and clicking Beta Reference Index.
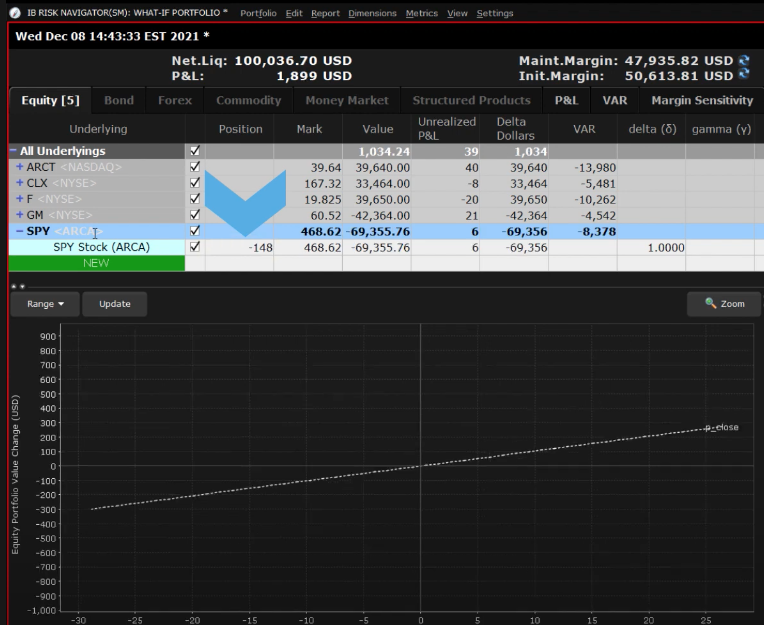
Before moving on, from the Underlying menu, I will select All underlying’s from the dropdown menu. Let’s now add two more positions – one long and one short. For short positions, simply enter a minus sign ahead of the position size.
Because we have added a short position to the portfolio, the gradient of the P&L curve has flattened. If the market rises by 10%, your portfolio is facing the drag from that single short position. Now if you go to the Underlyings menu and select the short position, you will isolate the position on the Plot Viewer and see that it slopes down from left to right, with losses building as the market rises, and increasing as the market declines.
Reset the Report Selector by choosing All Underlyings.
In the Position table at the top of the screen, I’m including a column for Delta Dollars. This is defined as the delta for the position multiplied by the price of the position. Stocks generally have a delta value of one, which means that the delta is the same as the position size. Option contracts have lower deltas since their price sensitivity to the underlying is a function of the characteristic of the option, such as the closeness of the strike price to the underlying, how many days to expiration and implied volatility. The idea behind measuring delta dollars is that it common sizes your positions according to the expected price movement of the underlying and displays an aggregate value.
With this portfolio construct, we have three long positions and one short position. I am next going to enter an ETF benchmark representative, such as SPY. Then I will enter a “hedge” position whose value will approximately negate the long delta dollar value of the portfolio. The idea here is to evaluate how many shares in the ETF would equally offset your portfolio risk in the event you wanted to avoid market risk for a period for whatever reason.
You will now see that in the Plot Viewer the P&L line has flattened considerably. If I hover the cursor over the up-10% level, how relatively little the associated reading of potential profit is, since the hedge position is kicking in.
Between the Underlying and Position columns is an include/exclude check box next to all positions. Note that this feature is only available in the what-if portfolio. By default, all positions are included. But you can exclude by simply removing the checkbox. Let’s uncheck the SPY position and now check the reading of an up-10% move on the portfolio.
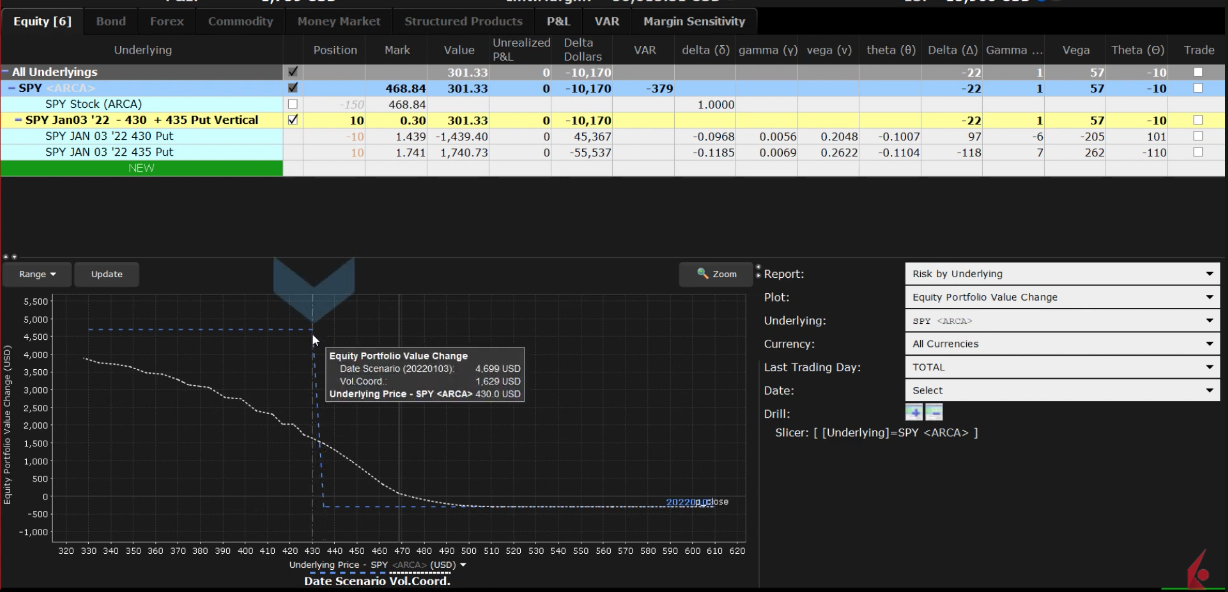
For the next example, I will exclude the SPY ETF position and enter a bear put spread using SPY options instead to illustrate how the value of the portfolio might look when using derivatives. I’ll deselect the SPY position. I will enter SPY in the NEW input field and select Options and Combinations. I’ll add a put spread. And then enter a value in the position field.
We can see now how the typical 45-degree P&L line is changed by adding a strategy that is intended to increase in value should the market decline.
Remember that we can also select from the Underlying dropdown menu the option position in SPY to see its profile independent of the other stock positions. Bear in mind that this is live data, so that by hovering the cursor above the line, you can view the current P&L value for a given price or percent change in the underlying SPY.
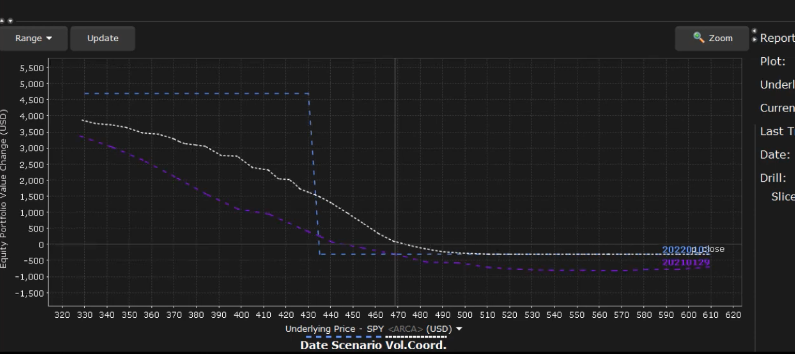
Let’s add the view at expiration. To do access the Date dropdown menu on the Plot Selector and choose the appropriate expiration date. Now the Plot Viewer displays the live and at expiration view for you to better understand expected portfolio impact for a given change in the price of the underlying at a specific point in time. Access the Date dropdown menu again, and this time enter any date in the Custom Date input field. When you now look at the chart you can interact with current, custom and at expiration views.
Finally, let’s exclude the SPY put spread, and add a short call position to one of our underlying positions. Enter the ticker symbol and choose option, then locate the desired strike and expiration to add to the Portfolio table.
Enter the appropriate number of short call options in the Position input field. Now let’s select just this underlying symbol to see the impact on P&L in the Plot Viewer. Again, let’s add the expiration date to the display. The P&L plot is no longer a 45-degree line. Rather it flat lines at the selected strike price to indicate a maximum gain as the stock is called away at expiration at and above the strike price.
Finally, we have purposely shown you the Plot Viewer using Equity Value Change in the display. However, do take the time to review additional displays available in the Report Viewer. While the Portfolio selection provides an identical P&L profile in the plot, it does simplify the Portfolio display at the top of the page into fewer columns.
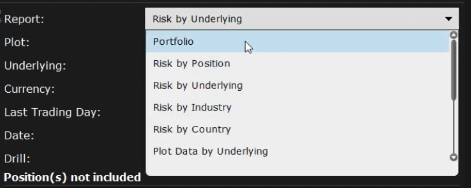
The Industries tab orders your portfolio holdings into industry and sub industry holdings, groups and then subgroups, so that you may visualize your holdings at a granular level. By selecting industries, the Portfolio tab is resorted for you to drill down into that sector.
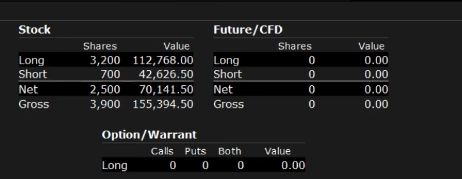
Towards the bottom of the report Selector menu you will see Portfolio Statistics, which provides a condensed view of portfolio positions by long/short shares and value.
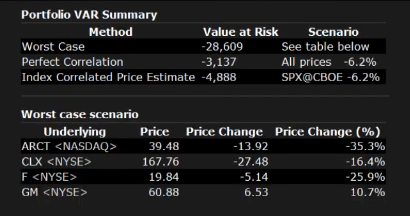
And then see the Value at Risk report for Scenario analysis on your individual positions.
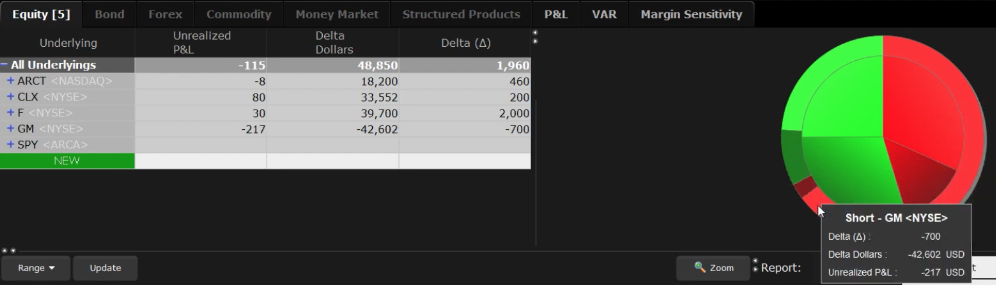
Finally, the P&L Pie chart displays your position risk and P&L colorfully using two rings. The inside ring depicts position by symbol and position delta. Use the mouse to hover over to create a pop-up informational display. The outside ring shows unrealized gains and losses.
 The Plot Viewer and Report Selector together enable the investor to quickly and easily define the profit and loss expected from a portfolio as the market rises and falls. What we have shown you in this lesson should help you navigate the Risk Navigator tools faster. And remember that the what-if portfolio can be used to learn expected margin requirements as well as risk metrics under many different scenarios. You can build and save what-if portfolios and access them anytime.
Join The Conversation
If you have a general question, it may already be covered in our FAQs. If you have an account-specific question or concern, please reach out to Client Services.