

")


Study Notes:
Now that we’ve covered ways in which you can use watchlists and scanners in TWS for trading and investing in fixed-income securities, we’ll now show you how you can use multiple tools in one dedicated place, including filtering bond criteria, creating charts, and entering orders.
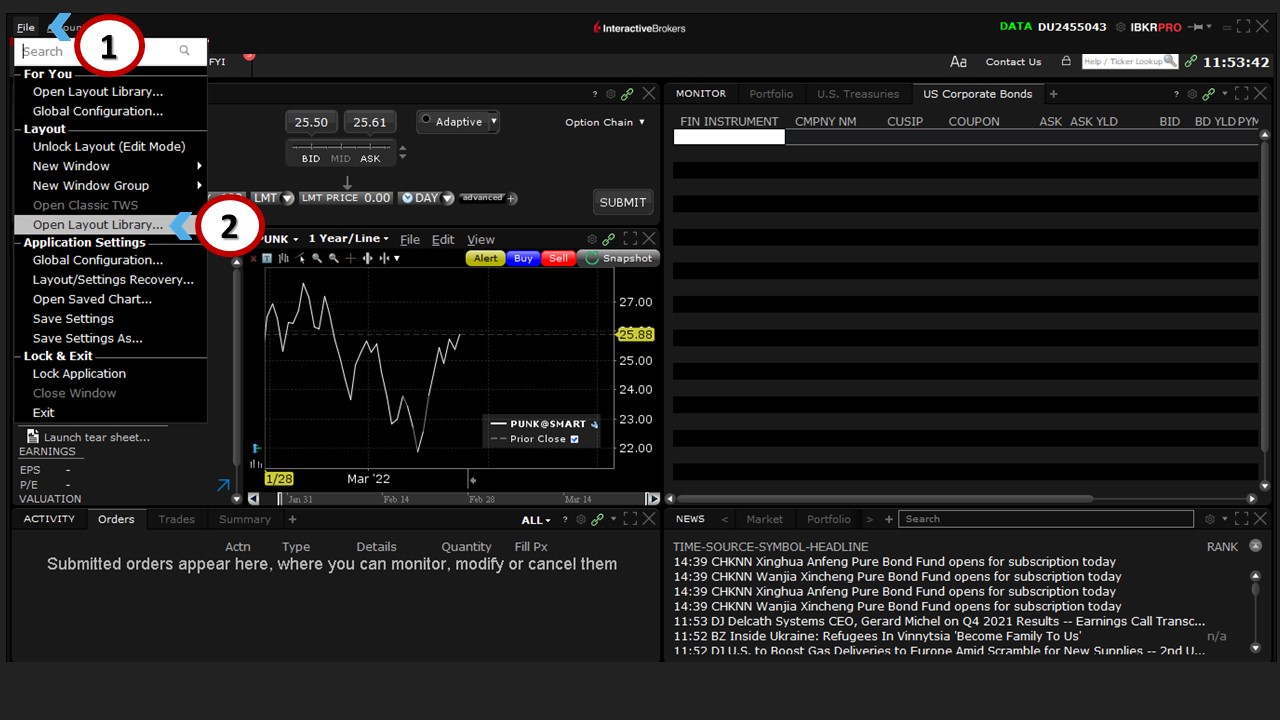
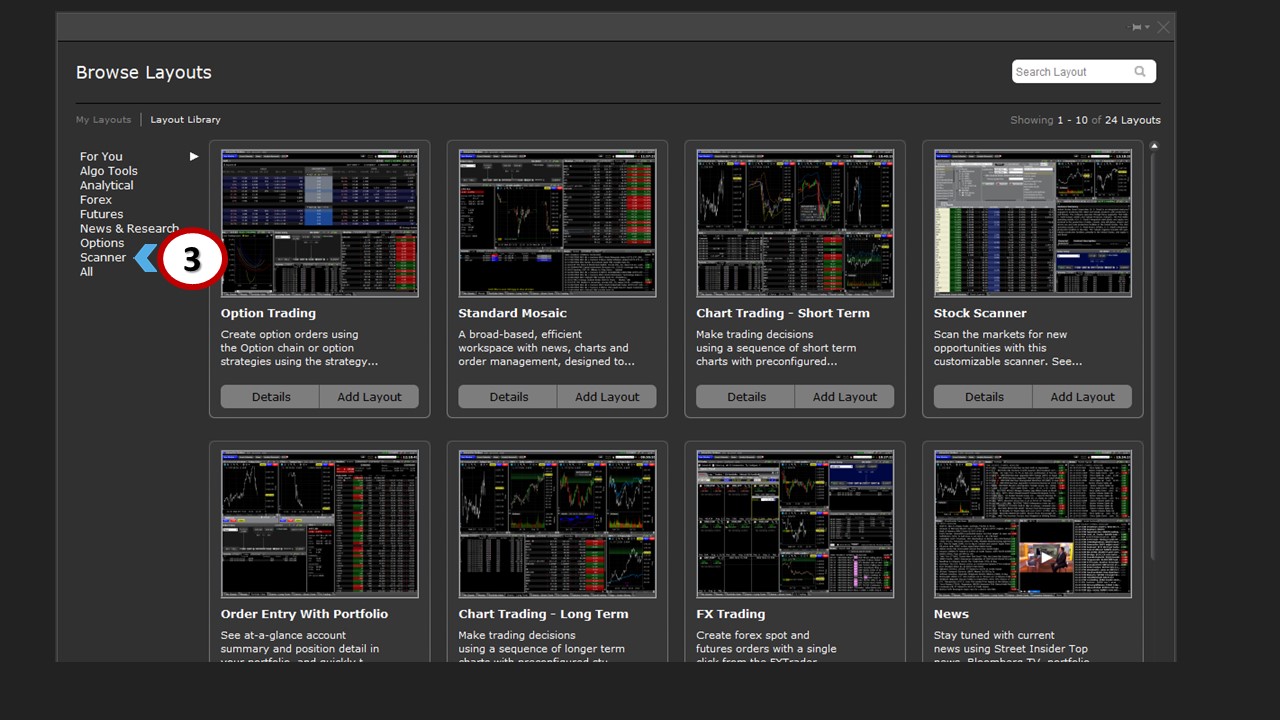
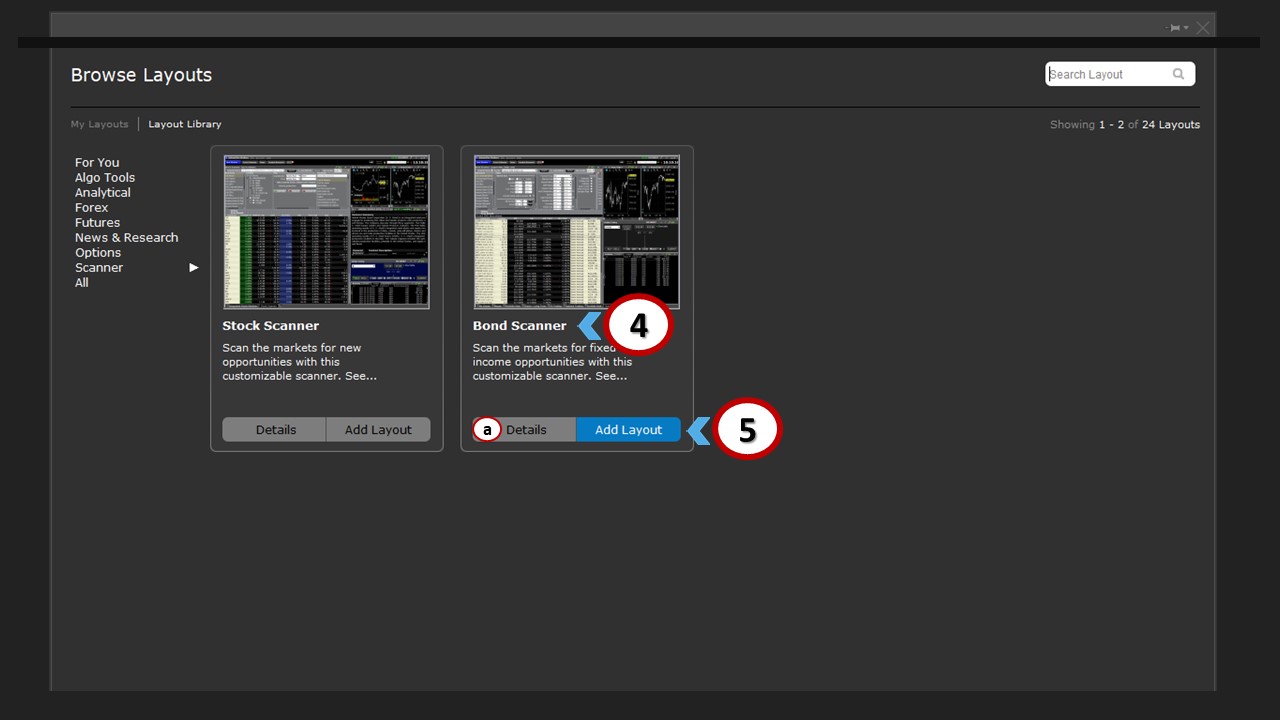
The Bond Scanner Layout provides all these tools in one location. To access it, (1) click File, (2) Open Layout Library, (3) choose Scanner from the list, and then (4) Bond Scanner. You can (a) read more details about the layout, or (5) simply add it to your workspace.
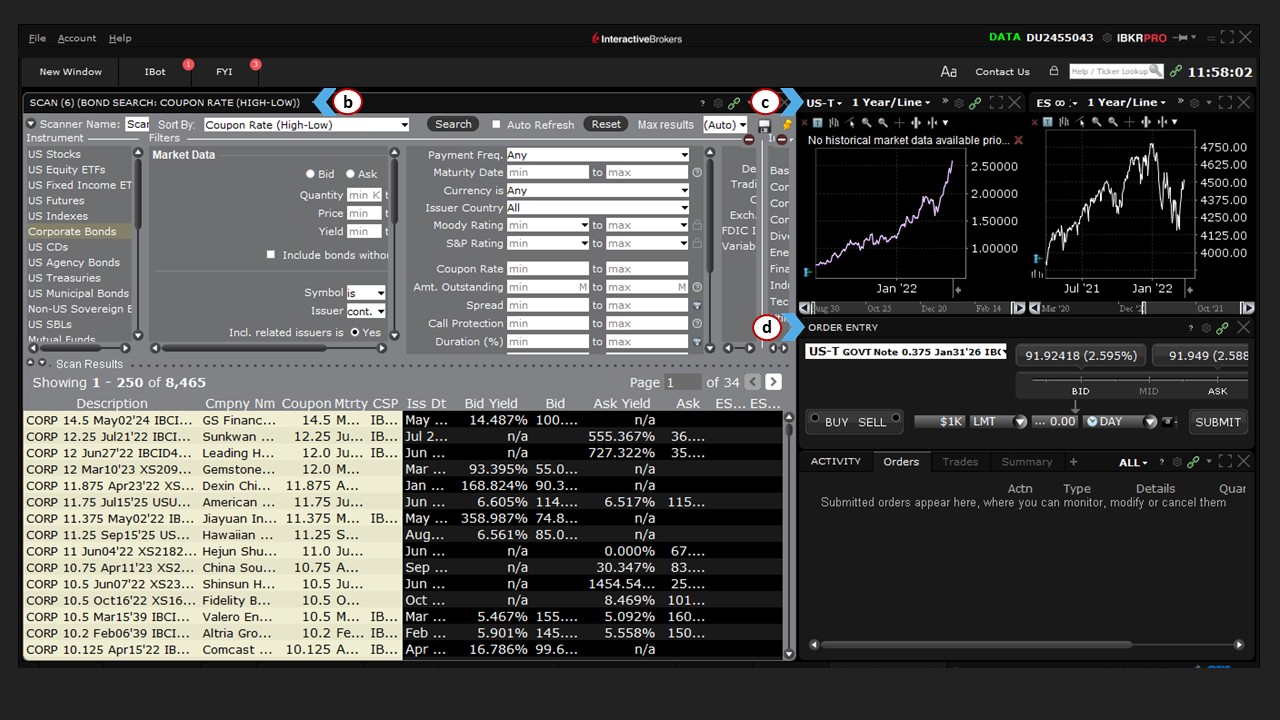
 A new window will then open with (b) the Advanced Market Scanner at the left, (c) charting tools at the right, as well as (d) the Order Entry panel, where you can make buy and sell decisions.
 How do these panels work together?
 How do these panels work together?
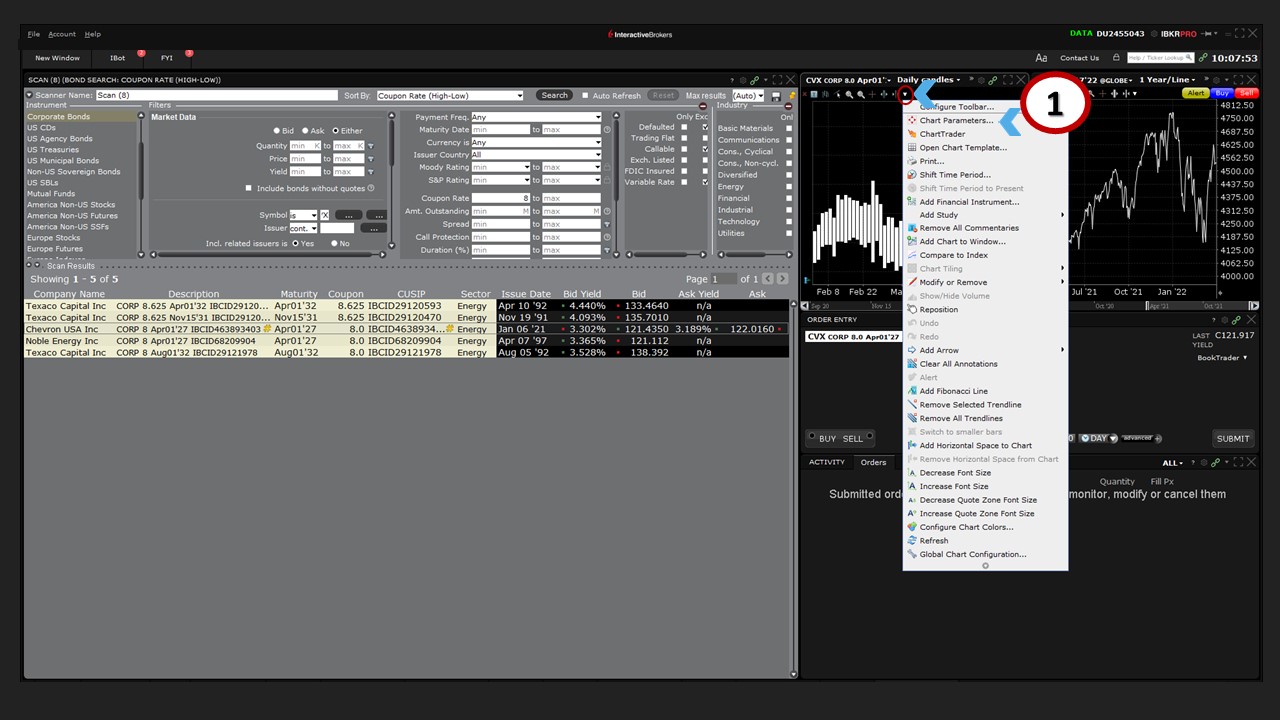
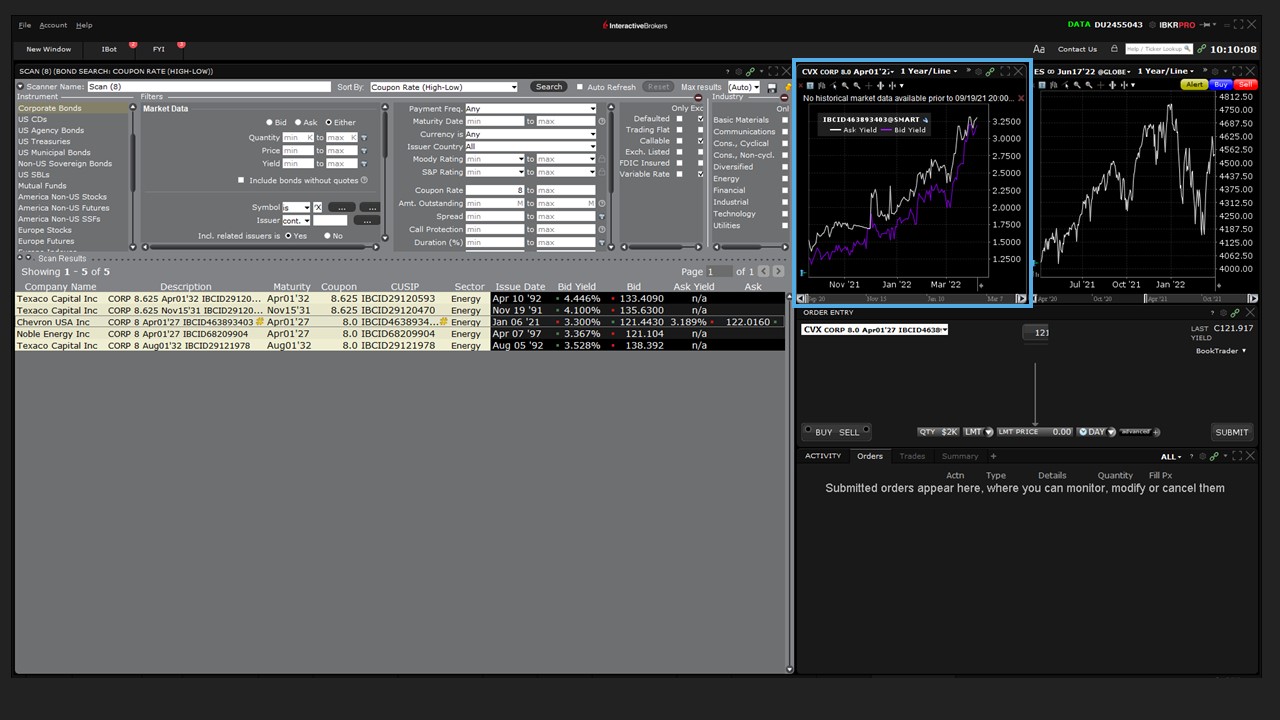
You’ll notice that many of these panels are color-linked, for example using (a) green chain links. If you (1) click on one of the Corporate Bonds listed in the Advanced Market Scanner, (b) the chart with the same color-linkage will populate with the performance of that bond.

Charting Tools
Seasoned bond traders will be aware that many bonds trade irregularly, which is why bar or candle charts over a longer period might not be very effective.
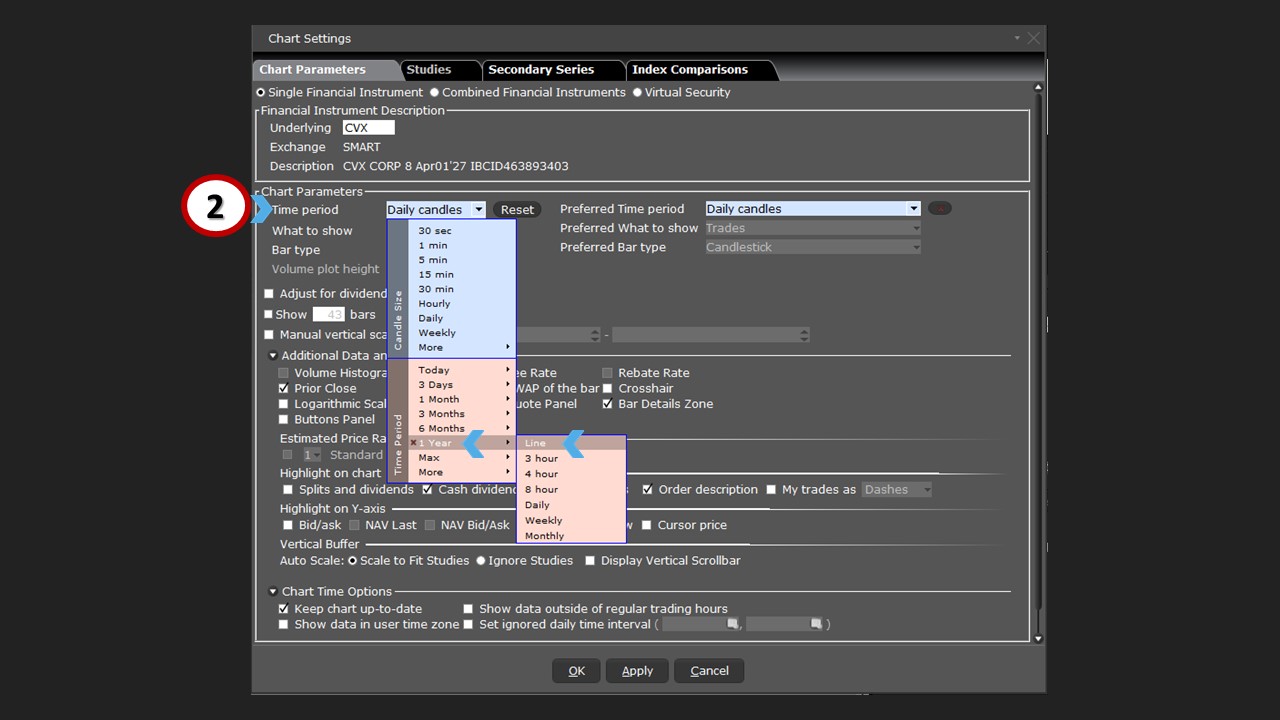
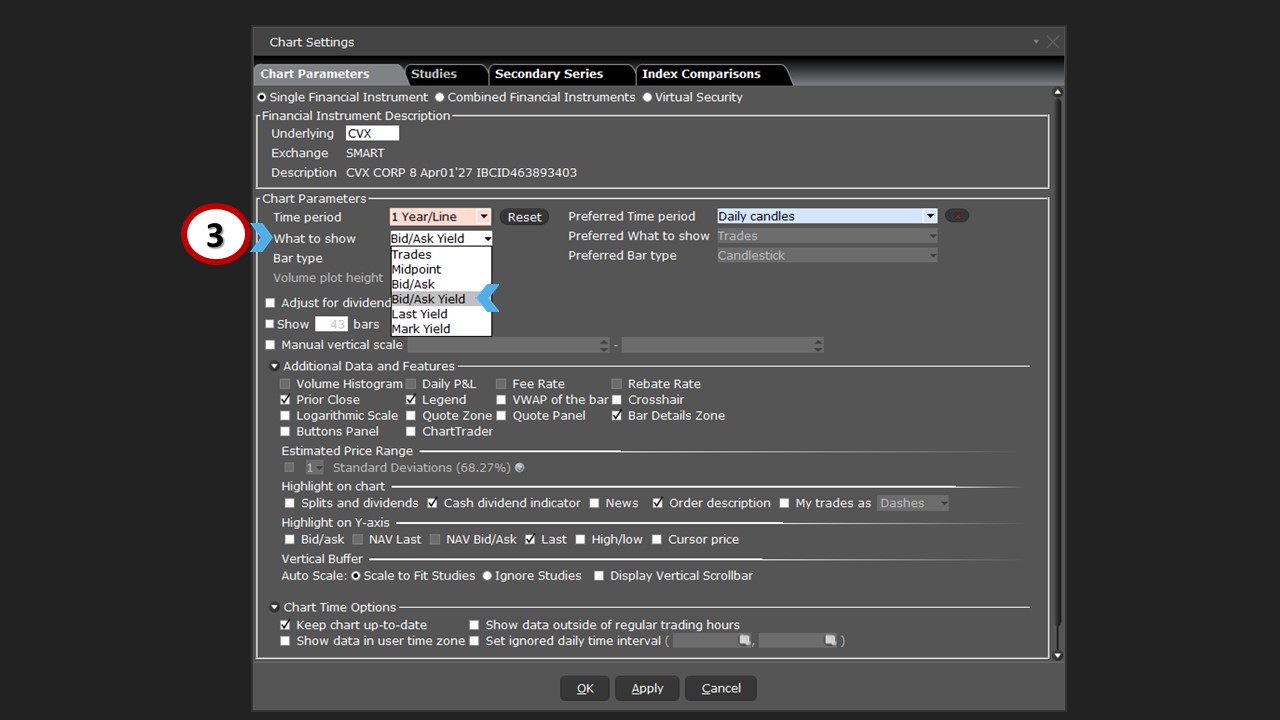
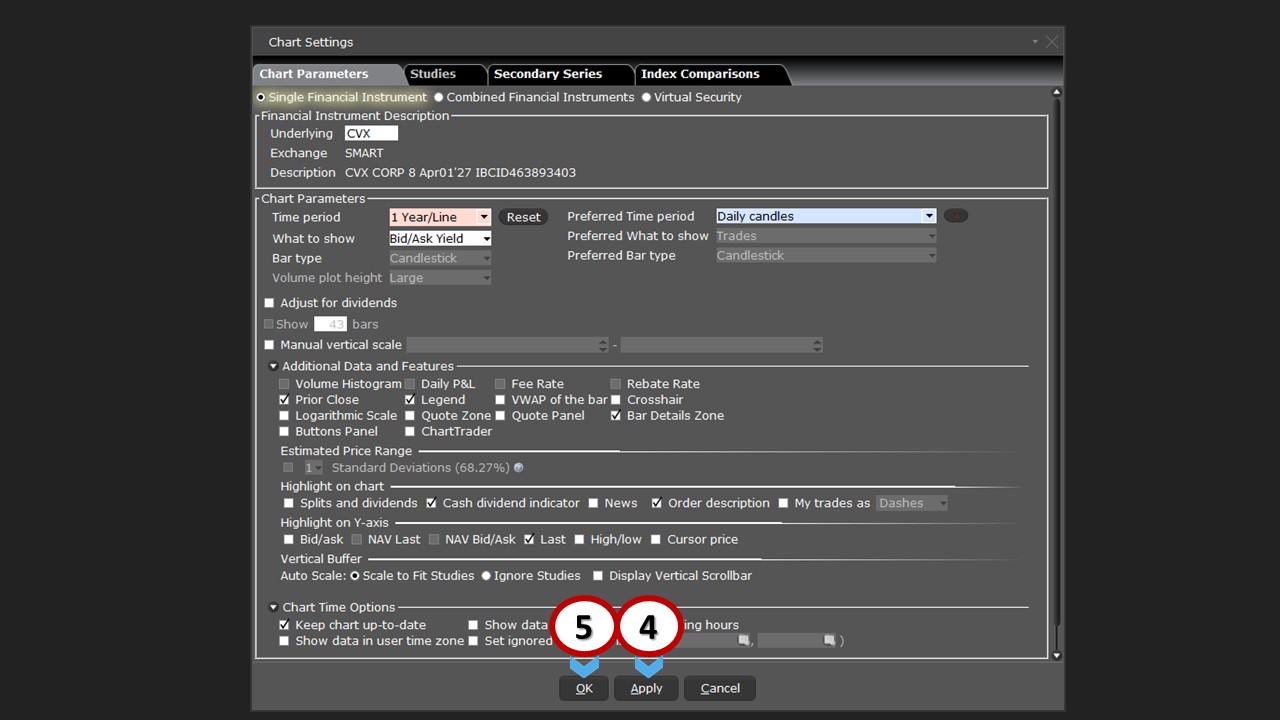
To change the chart settings, (1) use the Chart Parameters icon to edit the display. You may want to consider setting the view to (2) line from the chart time-period dropdown menu for the period you wish to see. You should also see the available settings from the ‘What to Show’ menu. Here, you can select from various yield settings. For this exercise, (3) select Bid/Ask yield and click (4) Apply and (5) OK at the bottom of the menu.
Order Entry
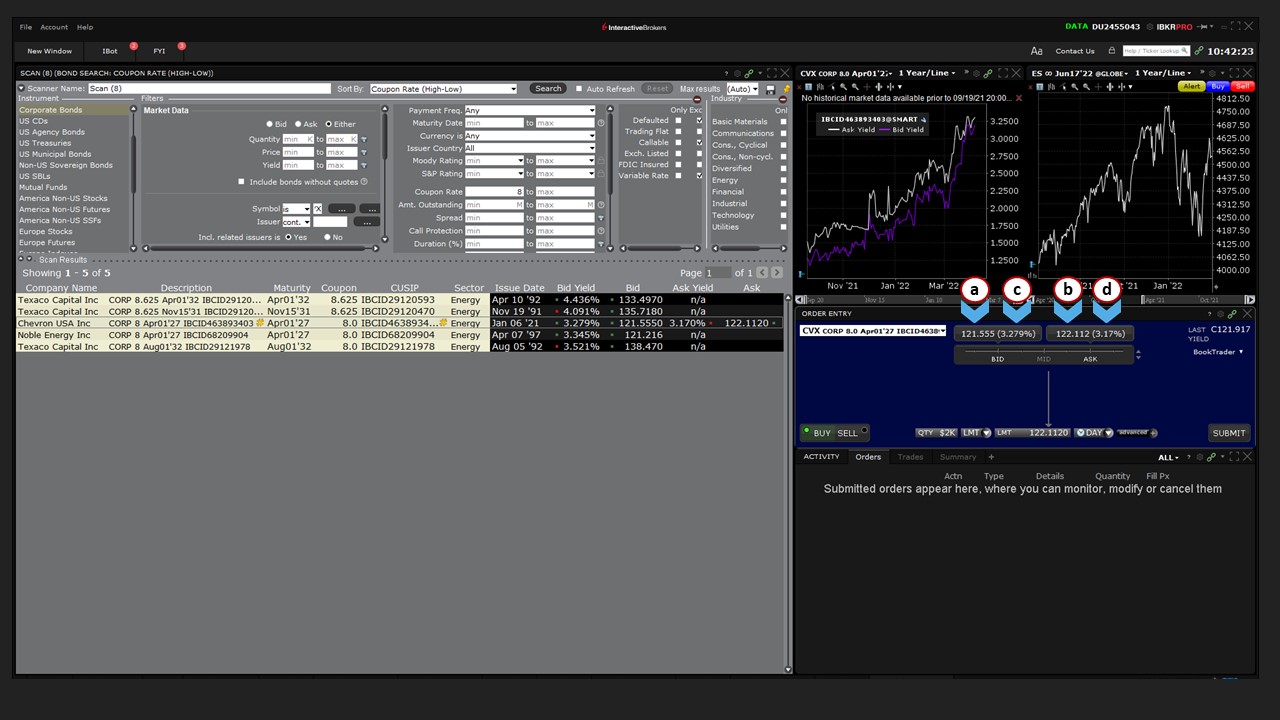
The (a) Order Entry panel has also populated with the bond that was selected in the Advanced Market Scanner – again, because the panels are chain-linked. With the bond loaded in the Order Entry panel, you will see in (b) the Ticker input field the description of the bond, including bond Type, Coupon, Maturity date, and IBCID.
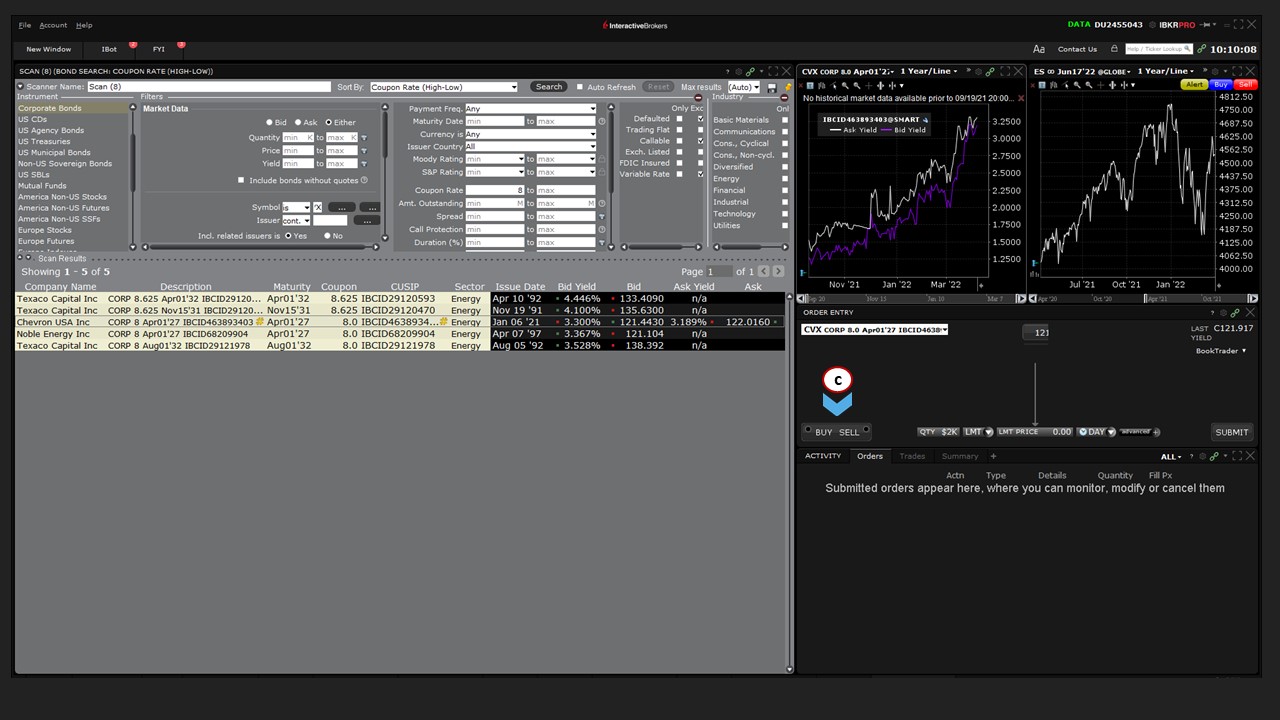
If you want to locate another recently used ticker, (1) click on another entry using the dropdown arrow. Below, you can see (c) Buy/Sell buttons. You must select one of these before an order can be submitted. Selecting (2) the Buy button will change the background change from black to blue, while (3) clicking on the Sell button will turn the background from black to red.
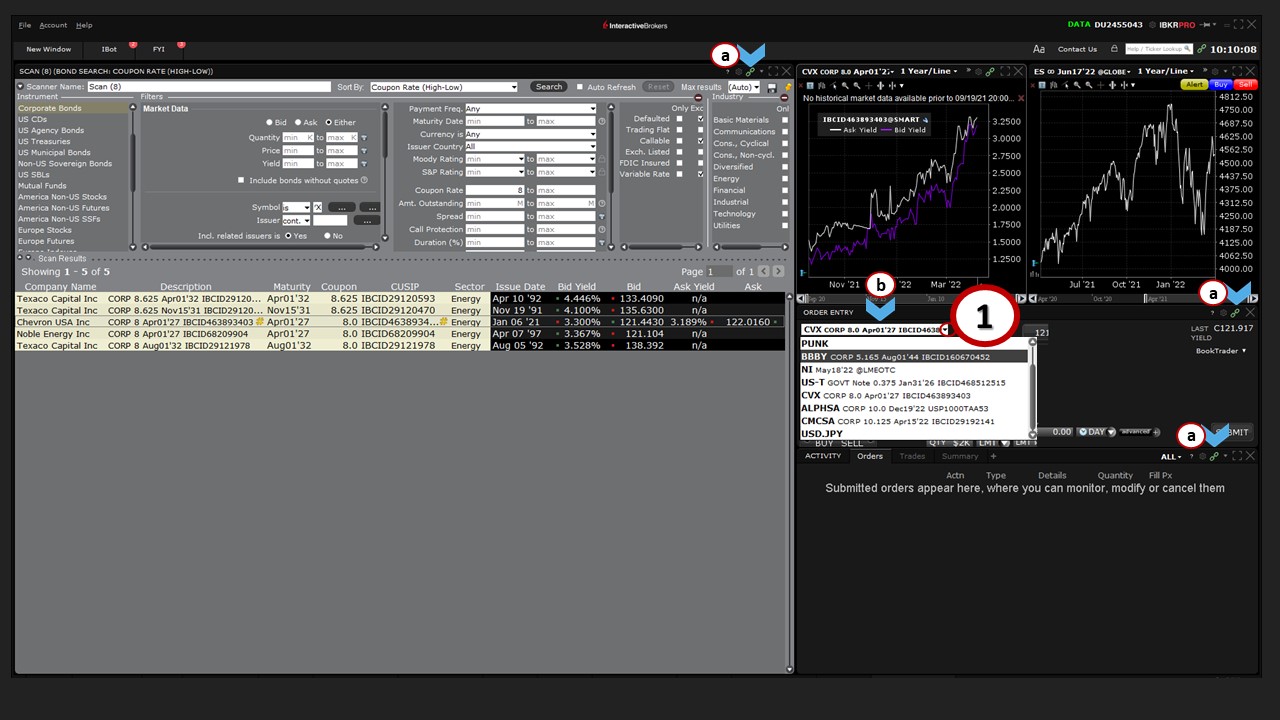
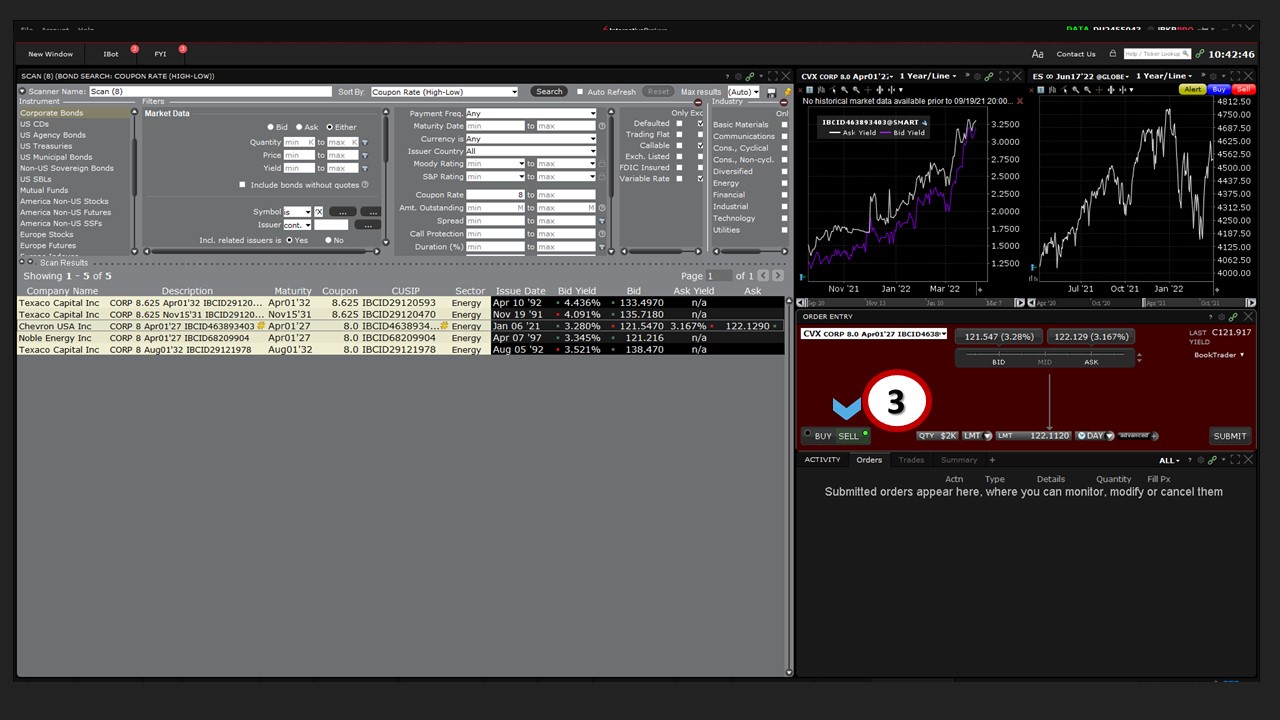
You should note that you can also select to buy or sell a bond directly from the Advanced Market Scanner. Simply (1) right click on a bond, and you’ll see options to buy or sell, alongside (a) other functions, including obtaining quote details, creating a new chart, and creating a specific alert.
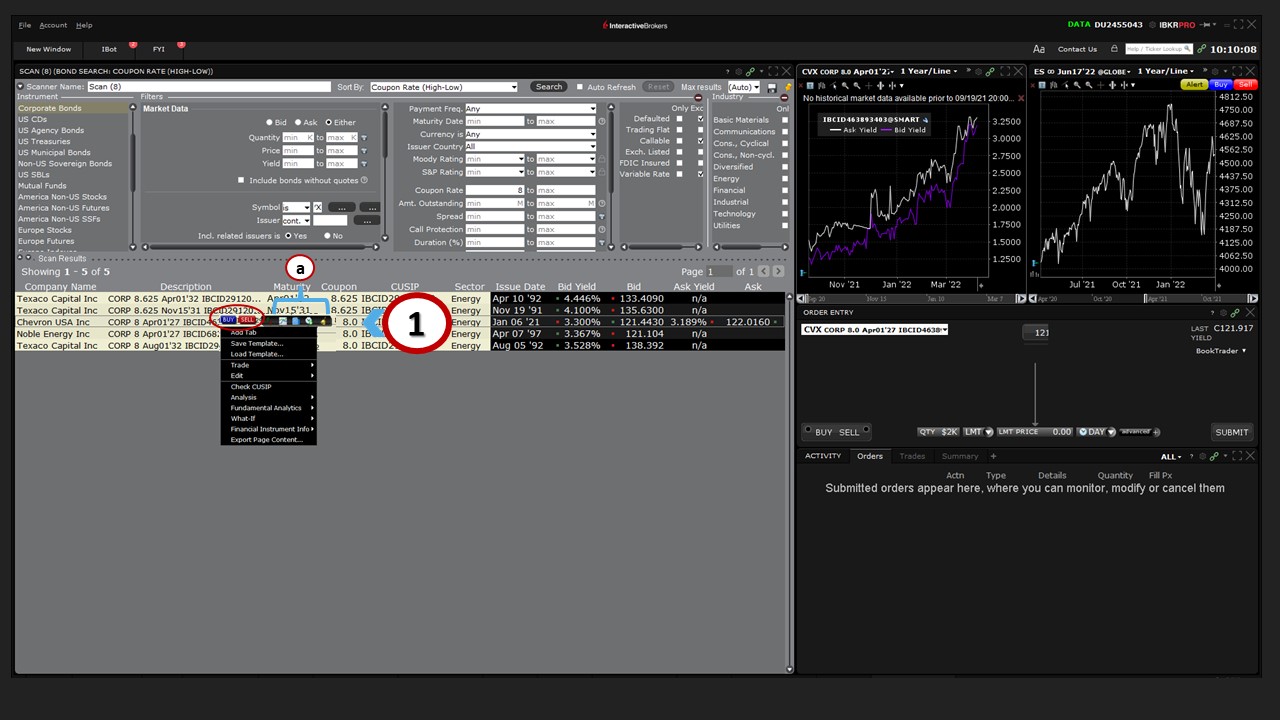
Note: The feature to buy or sell a bond directly from the standalone Advanced Market Scanner and Global Bond Scanner is also available, along with other functions, including obtaining quote details, creating a new chart, and creating a specific alert.
Prices / Yields
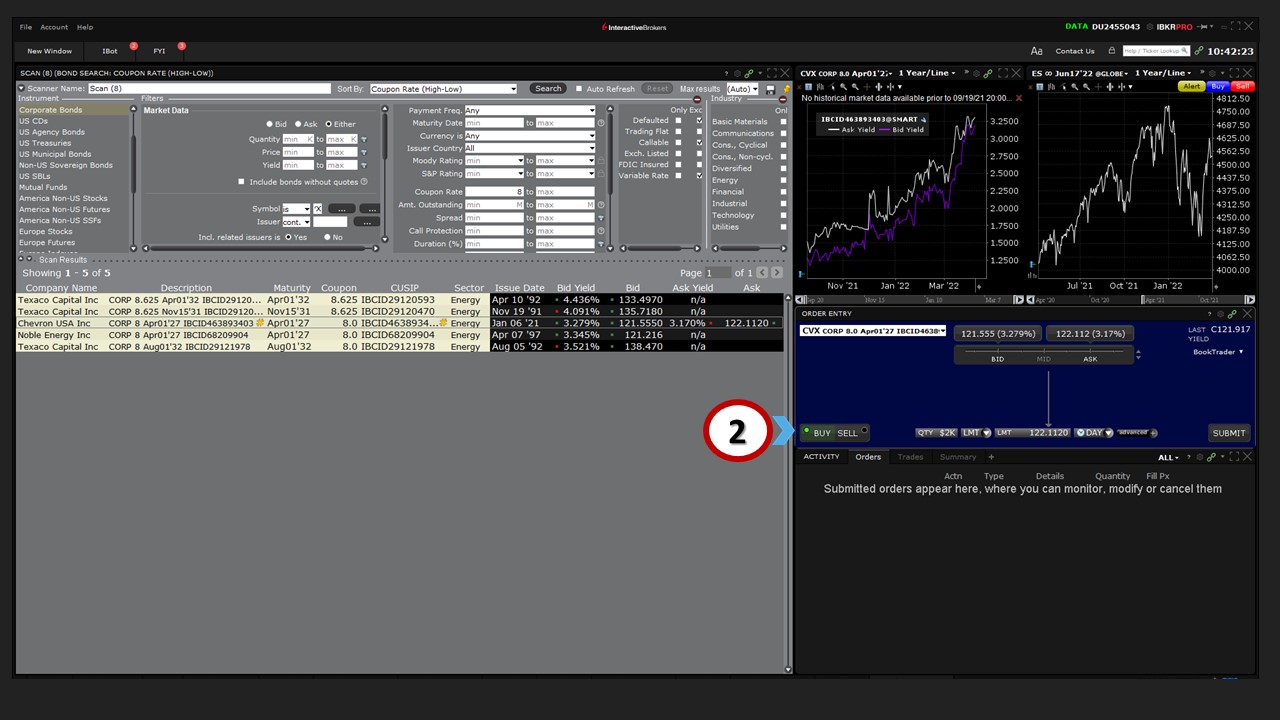
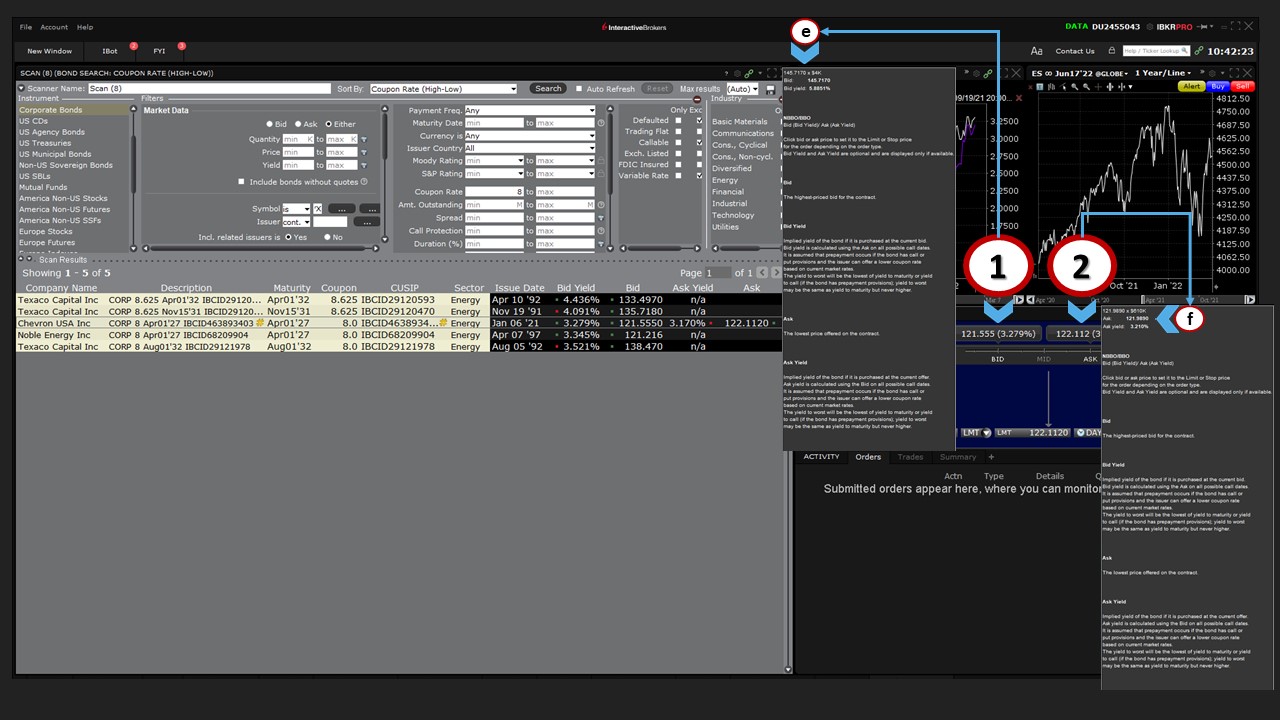
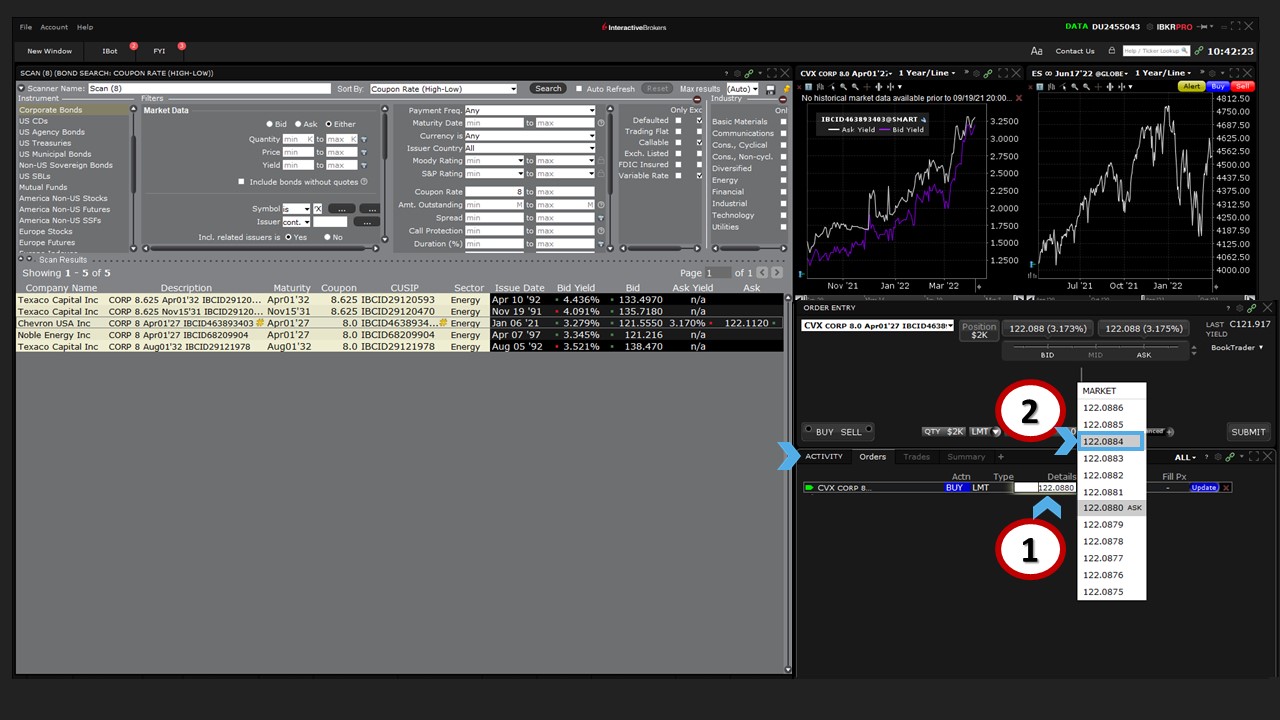
Back in the Order Entry panel, the default quote display shows (a) the best bid price to the left and (b) the best ask price to the right. The price display also shows the yield associated with the (c) bid (bid yield) and (d) ask (ask yield). When you (1) hover your mouse over the bid price and yield display, a pop-up description will display populated with (e) information about the National Best Bid and Offer (NBBO), along with bid/ask definitions. At the top of the box, you will see a yield calculation using the current bid price, as well as the dollar amount of the current bid.
Hovering your mouse (2) above the ask display quote will show you (f) a similar image, except this time the yield is derived using the current asking price and dollar size of the best offered amount.
Immediately below the quote display is (a) a price slider. Here, you can slide the mouse and the quote display will show a single price point should you wish to choose a price relative to the bid or the ask – either above or below. If you (1) hover your cursor above the word ‘Mid’ on the price slider, the display will automatically calculate and display that price instead.
In the upper right corner of the Order Entry panel, you will see (b) summary data displaying the last traded price of the bond and its current yield, based on the mid-point of the live quote.
Quantity / Statutory Minimums / Level II Market Depth
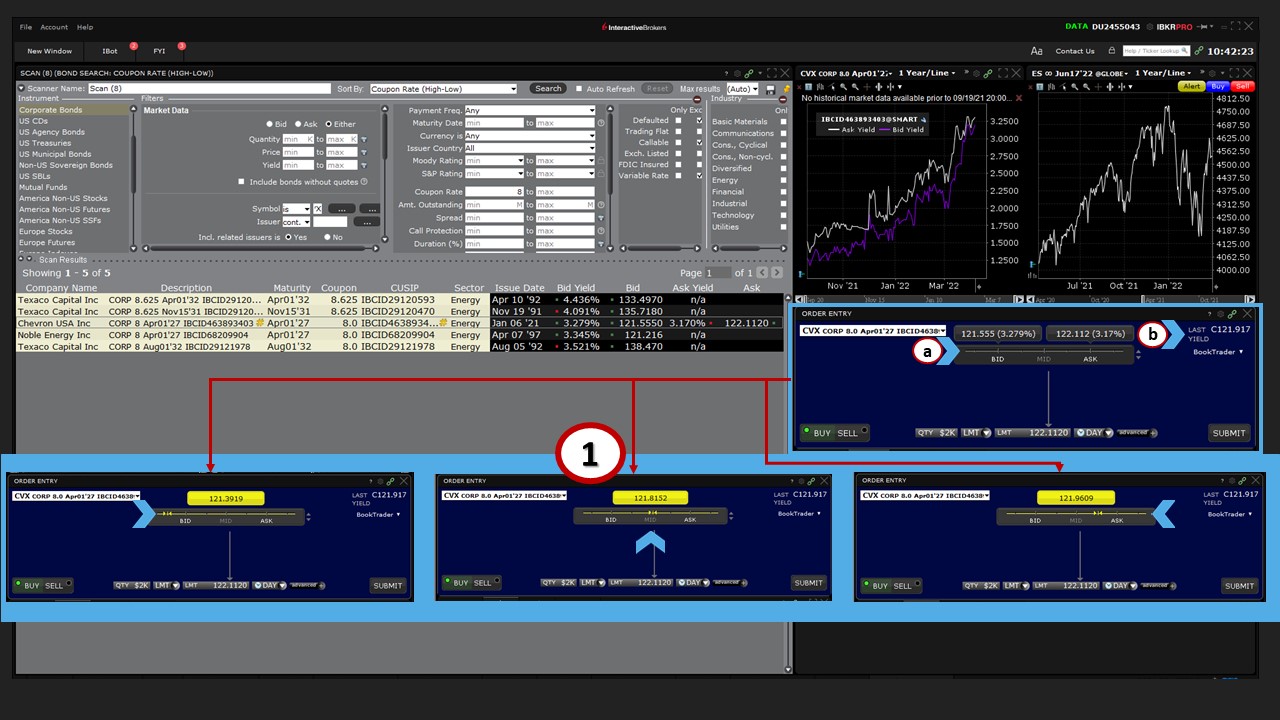
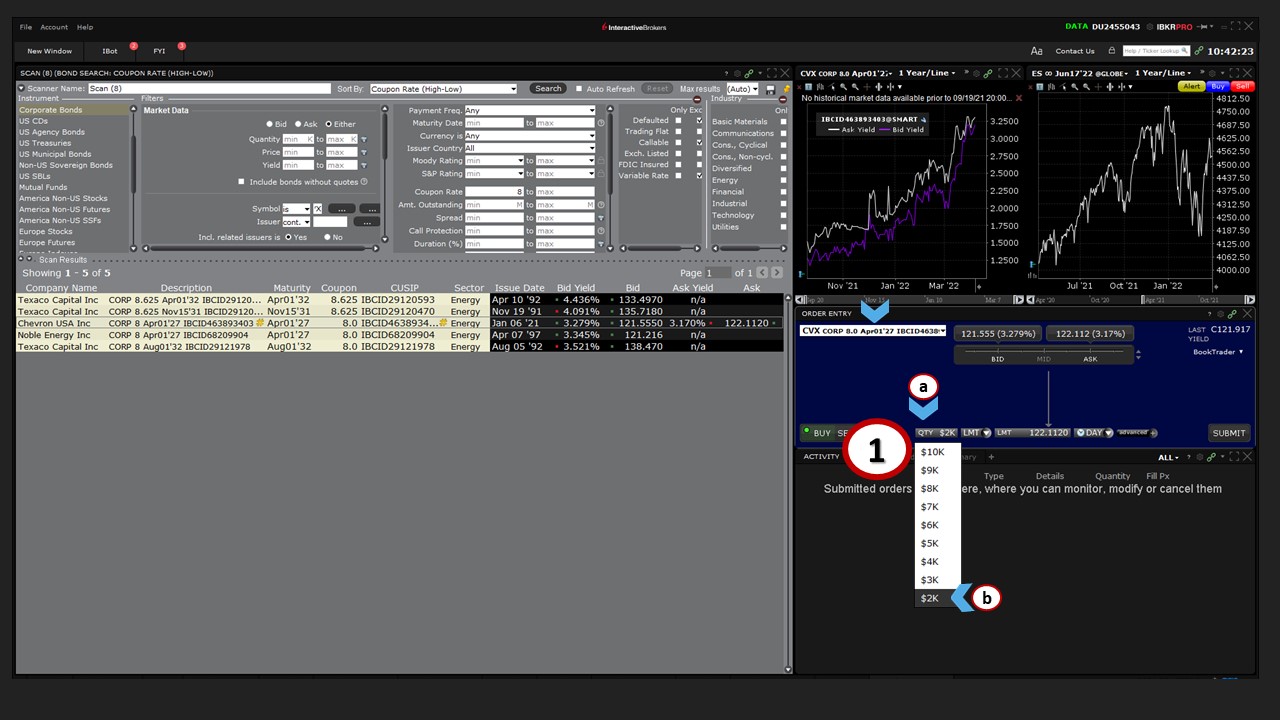
With the Order Entry panel set to Buy, let’s look at (a) the Quantity field. Typically, bonds can be bought and sold in minimum increments of $1,000, and when you load any bond, you should see the Quantity field display $1,000. However, some bonds are issued with statutory minimums greater than $1,000. If that is the case, the Quantity field will reflect the higher minimum, and if you (1) click that input field, you will not be able to choose a smaller amount than the hard-coded value.
See, for example, (b) Chevron’s 8% bond due April 2027 – which has a minimum quantity of $2,000.
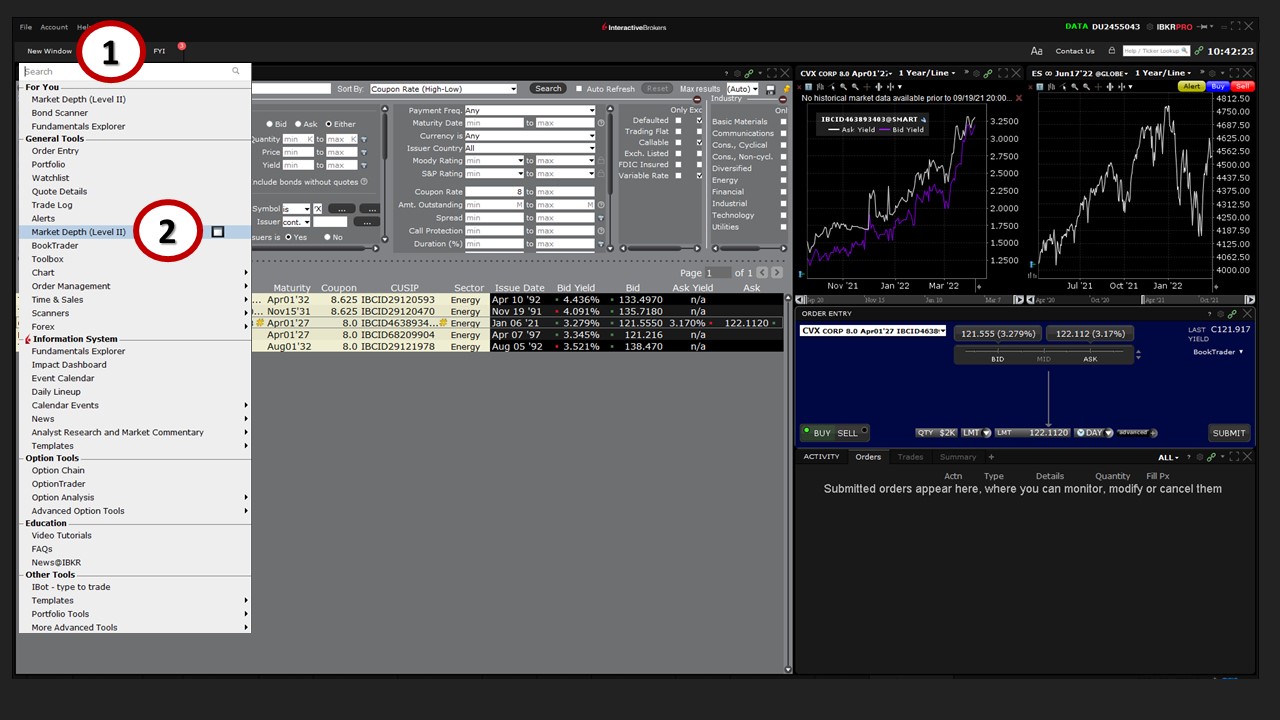
There may be other occasions when you may not be able to trade your chosen amount, due to market minimums. It may help to display the Level II Market Depth window from (1) the New Window button listed under (2) General Tools.
In the Level II Market Depth window, to the left, are (a) bids at each price level, along with (b) the size column, which specifies how much the bid is good for. To the right are (c) best offers, which again lists the volume available for sale. On either side you can see the (d) value for (e) the minimum trade size.
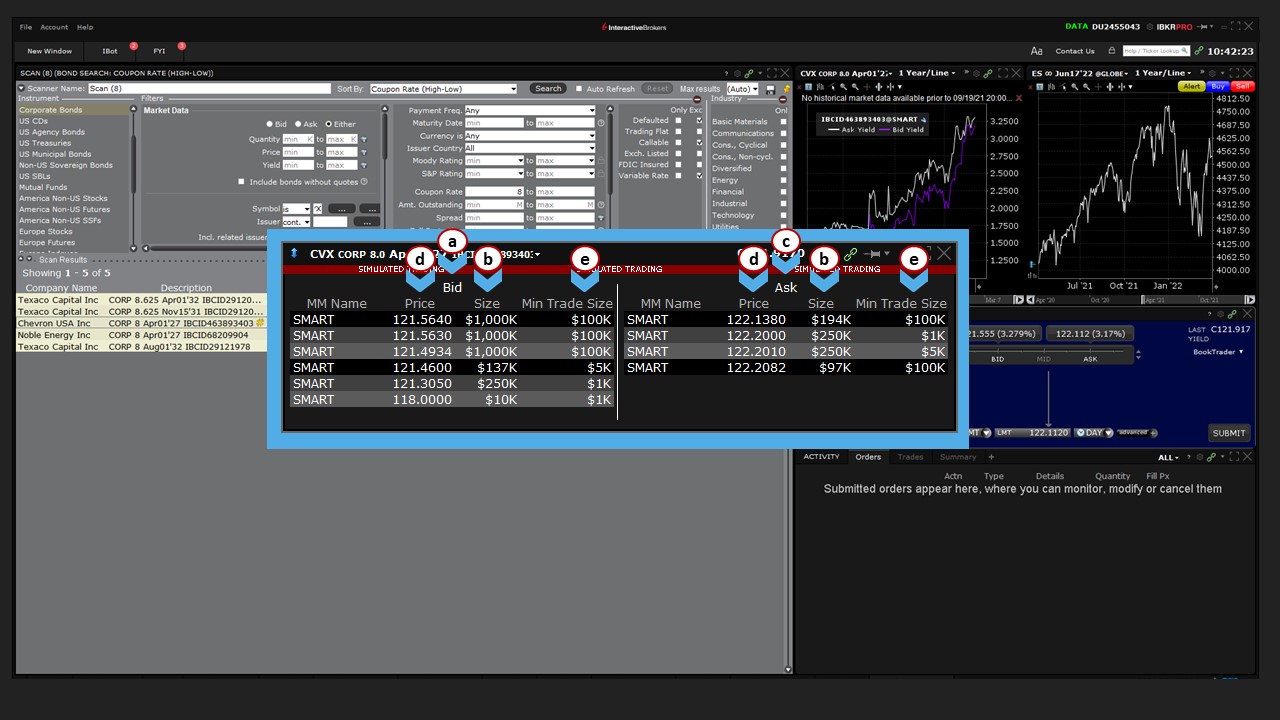
This should explain why, if you are trying to buy $1,000 worth of a specific bond with a market order, your order might not fill, because the only seller at that time and price is offering a minimum bond amount greater than what you want to purchase.
You can buy or sell using TWS using the minimums we just discussed. However, should you wish to sell short a bond, due to market practice and regulations, the minimum order size is $100,000, and the minimum increment is $25,000.
Order Type / Price Input Field
While most orders for bonds tend to be done as market orders, you may also set limit prices.
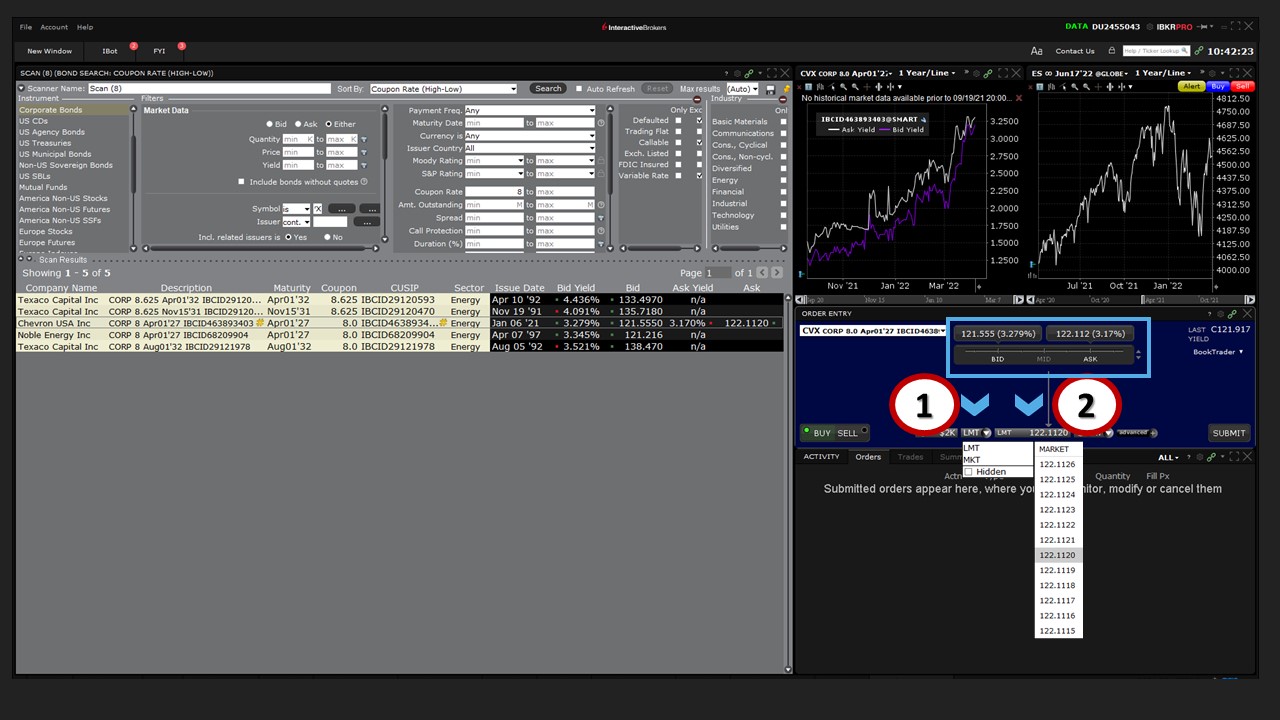
After choosing the amount you wish to trade from the Quantity field, use (1) the Order Type input field to select Limit or Market.
If you are using a Limit order, use either the price slider or (2) the Price input field to select your price. Note that the display highlights Ask, Midpoint and Bid orders and all prices in between. (See the “Prices / Yields” section above.)
Click to select the price, or you may also type it directly into the Price input field.
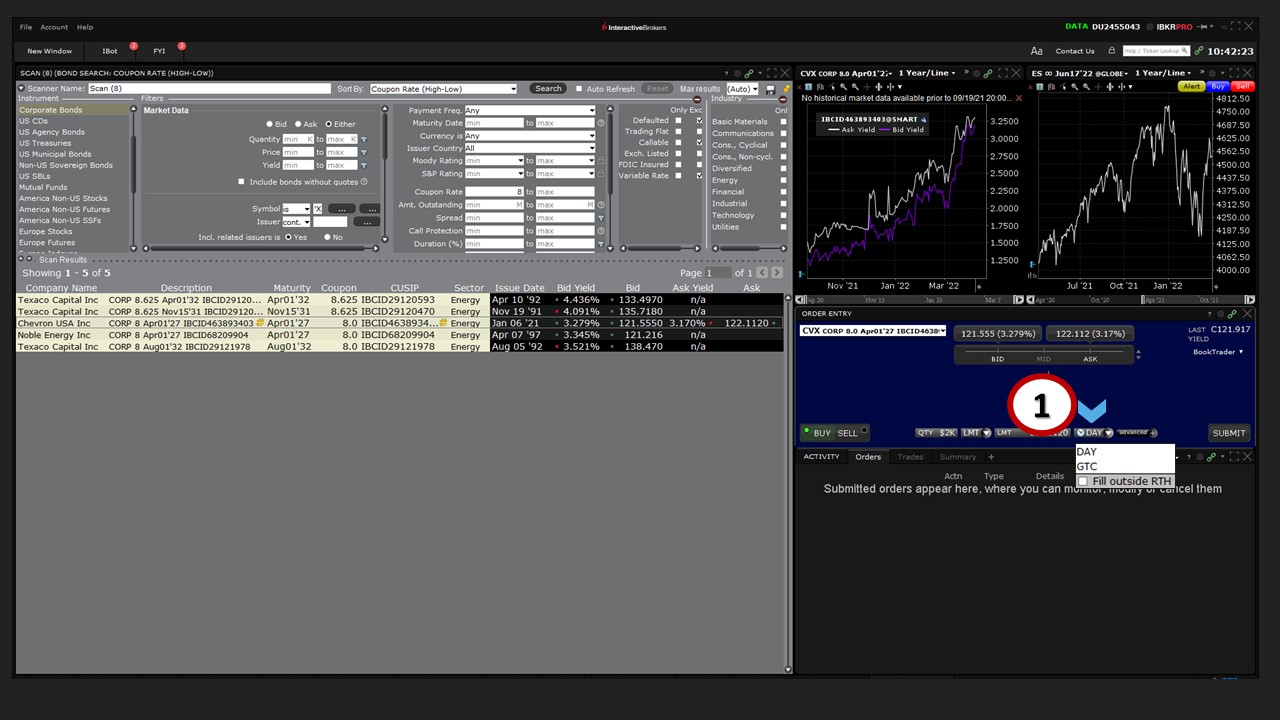
Time-in-Force
Select your (1) time-in-force, whether a Day or Good-Til-Cancelled (GTC) order, and decide whether you wish to check the Fill Outside Regular Trading Hours (RTH) box.
Order Submission
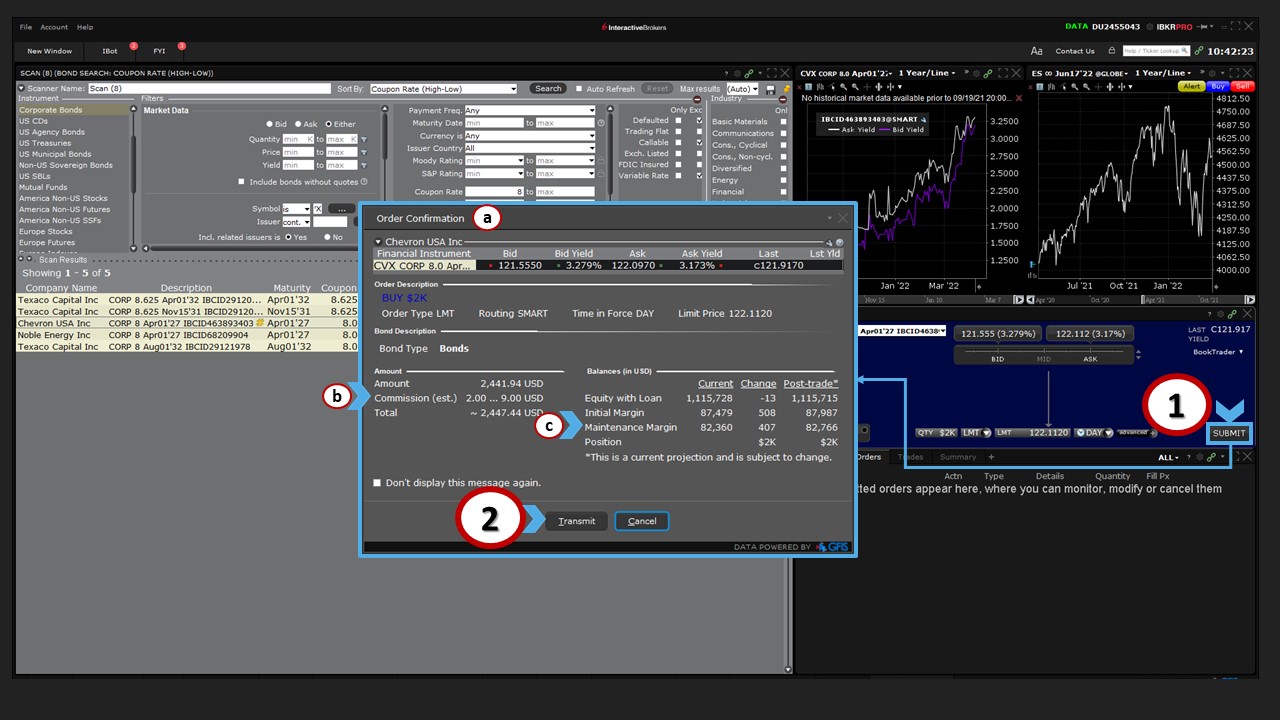
Once you’re satisfied, you are now ready to transmit your order.
You may create an Order preview ticket by (1) clicking the Submit button to the right. From here, you can verify (a) the details of the trade, as well as (b) the estimated commission charged by Interactive Brokers. The commission may be displayed as a range because it could execute on one of several electronic exchange venues. You can also see the estimated impact on your (c) available margin should the trade execute.
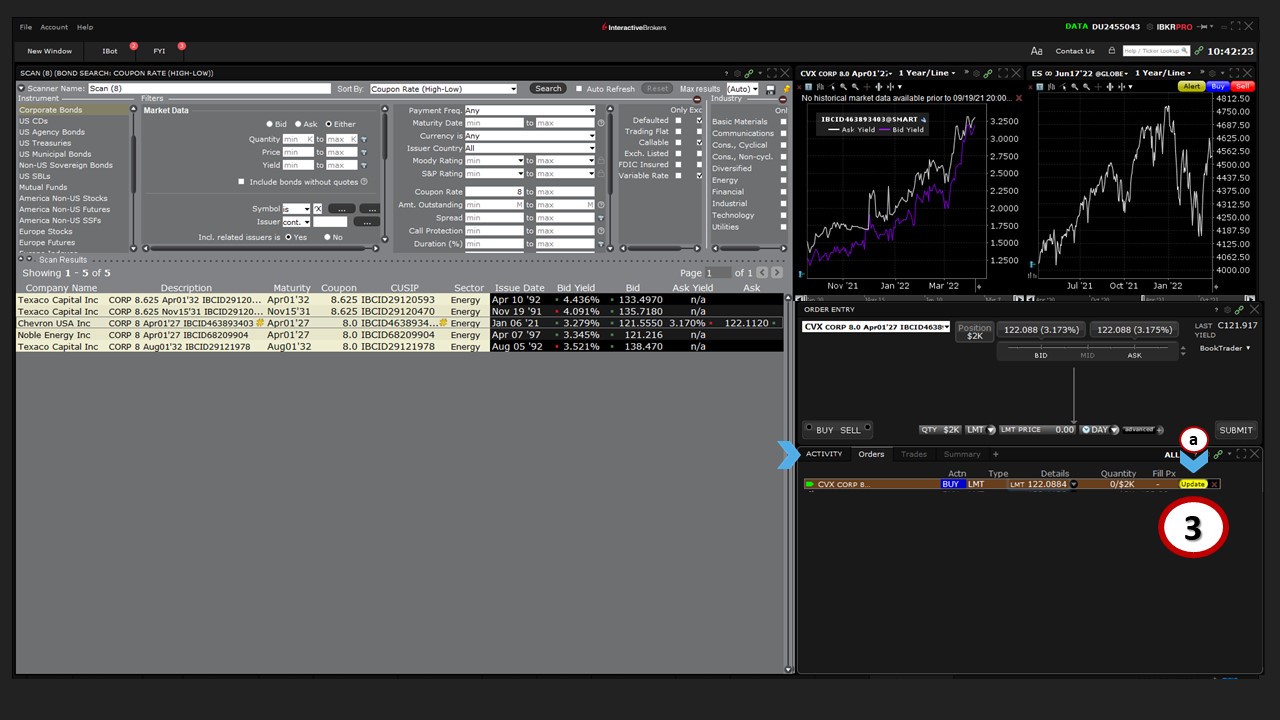
When you have verified and confirmed the order details, use the (2) Transmit button to enter the trade. Live trades resting on an exchange are displayed in (d) the Activity panel below on the Orders tab. Under the (e) Quantity column on this tab, you can see the current value executed as a proportion of the entire trade. The (f) Fill Price will calculate, and display, should the order fill. The (g) grey Action Button can be clicked if you wish to request cancellation of your order.
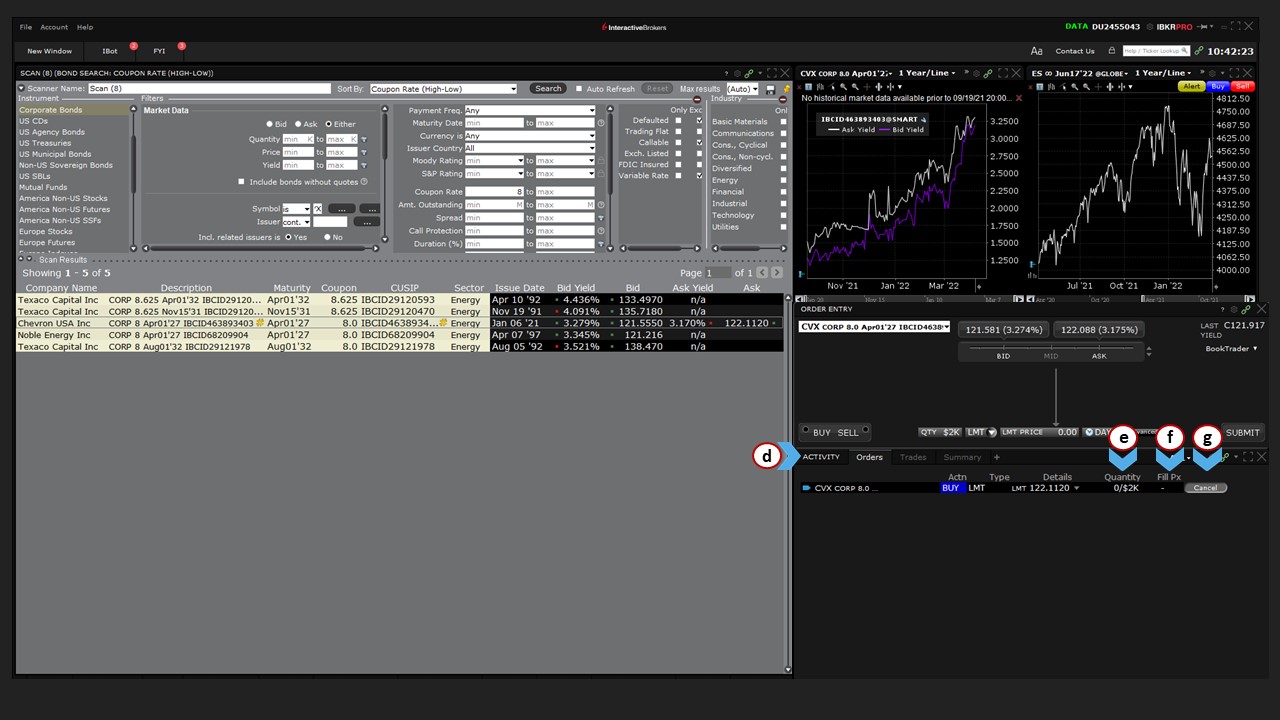
If you later decide to make changes to the price or other details of your order, you can do so from the Activity panel.
In this example, we’ll (1) click on the price field and (2) change the limit price. The (a) Action Button has turned from Grey to Yellow. When you are ready with your changes, (3) click the Update button to reinstate the remaining portion of your order with updated details.
Interrelated Scanners
Since configuration in the Advanced Market Scanner also affects the Global Bond Scanner, any changes made to the Advanced Market Scanner in the Bond Scanner Layout environment will also automatically apply to both standalone scanners.
For example, adding a column in the Advanced Market Scanner in the Bond Scanner Layout will automatically result in the same change to both standalone versions of the Advanced Market Scanner and Global Bond Scanner.
For example, if I add a column for Sector, you’ll see the same column will automatically and simultaneously appear in the other scanners when you access them.
You should now be able to access the Bond Scanner Layout, change chart settings, enter orders, and understand how to decipher market and statutory minimums should you encounter them across different bond issues.
Further Education
Learn more about different fixed-income products through other courses on Traders’ Academy, including introductory lessons about U.S. Treasuries, corporate, and municipal bonds.
Join The Conversation
If you have a general question, it may already be covered in our FAQs. If you have an account-specific question or concern, please reach out to Client Services.