


![[Gamma] Scalping Please](https://ibkrcampus.com/wp-content/smush-webp/2024/04/tir-featured-8-700x394.jpg.webp "[Gamma] Scalping Please")


Study Notes:
In this lesson, we will focus on chart configuration, including adding relevant elements and where to locate setting choices. Plus, we’ll explore and customize the toolbar icons shown on the chart. There is a lot of material in this lesson so feel free to pause if you need to and follow along with TWS.
Before we take a deep dive into Global Chart Configuration, here are a few examples of display settings within the Configuration menu.
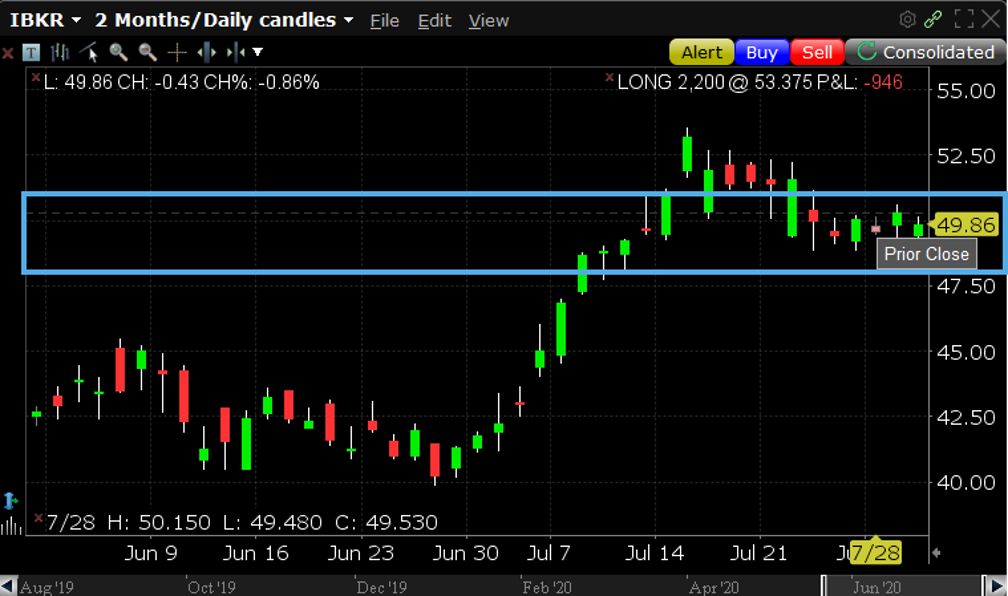
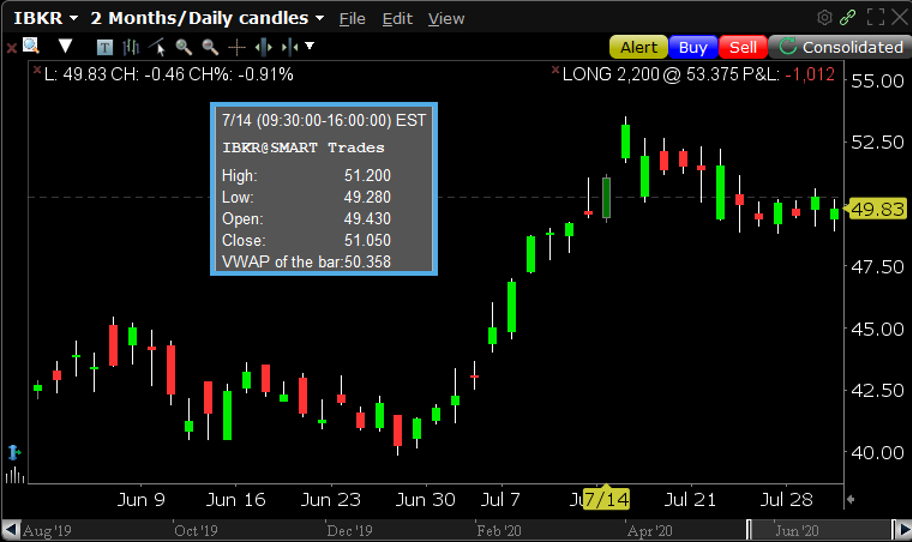
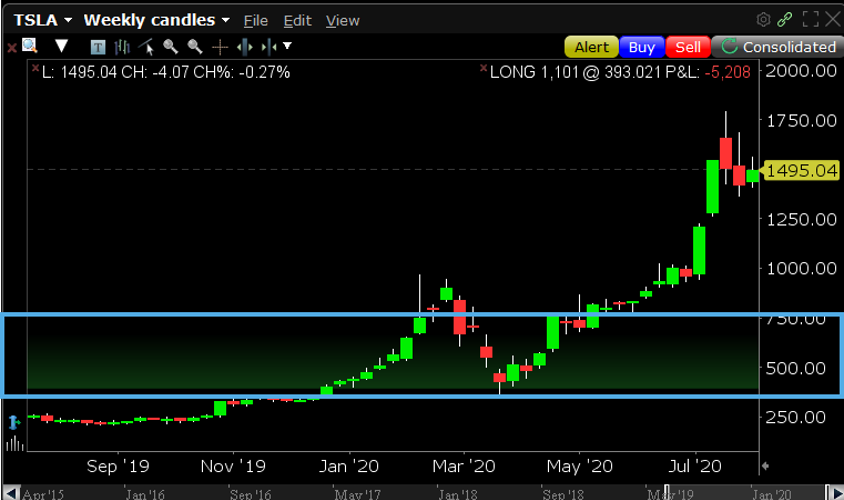
Prior Close
These shortcuts are very handy, as they allow you to quickly change the chart display. If, for example, you want to show the Prior Close on your chart, you can simply select this radio button – and a dashed-horizontal line readily appears showing the prior session’s closing price.
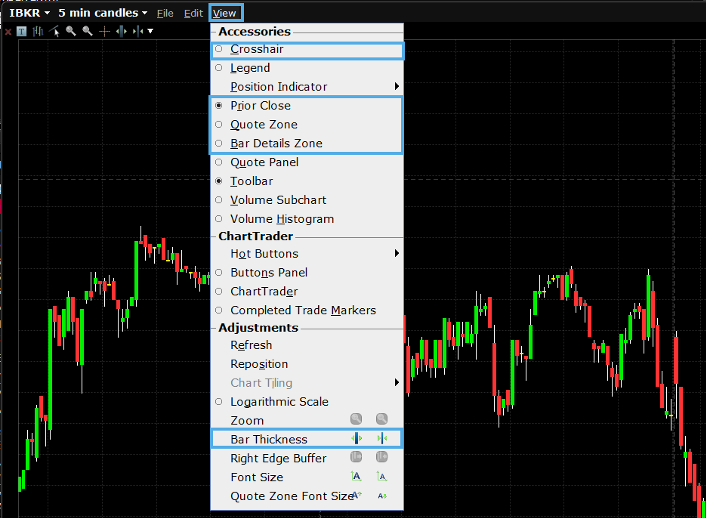
Quote Zone
Quote zone can display the last traded price, change on the day, position size and P&L.
Bar Details Zone
Over here, you’ll see the Bar Details Zone, which will show a variety of details driven by your Configuration set-up.
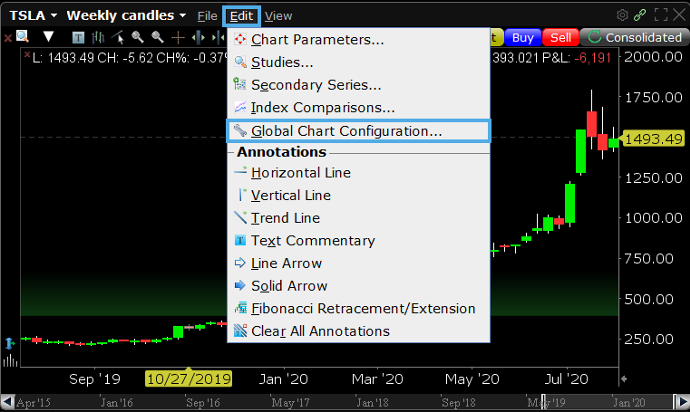
Use Global Configuration to adjust the chart settings.
- Select File from the main TWS menu or Edit menu on the Chart.
- TIP: You can add a Global Configuration toolbar icon for quick access.
- Once you have it opened, locate Charts from the panel on the left and ensure the PLUS button is expanded.
- From there you will see a list of chart-related choices including Settings, Toolbar, Chart Colors, Quote Zone and ChartTrader.
- Each of these options has its own configurable settings, and when you select one, you’ll see the extensive choices you have to control their displays.
- Then I click on Settings, for instance, a long list of available attributes appears on the right, where you’ll need to use this scroll bar to see all the offerings.
- To show you how certain features work when displayed, I’ll first click the pushpin to keep the window set on top of TWS.
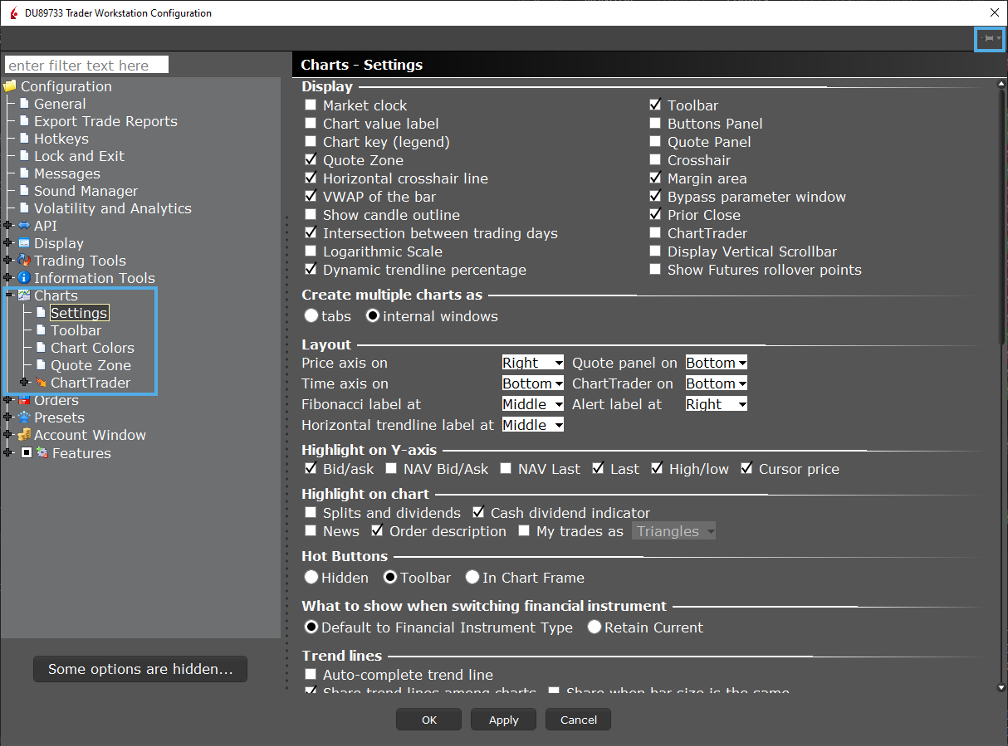
Chart Settings
The Settings configuration area is broken into various menus. At the top, you will see Display and Layout, and lower down on the page you will see sections for Trend line and Font configuration, Tool tips, Graphical position indicator, order display and other items.
Let’s start at the top.
- The Display section allows you to select items that will appear on your chart. We can test this out by checking the box to the left of Market Clock, then click Apply at the bottom of the window.
- By doing this, do you see how the time stamp now appears on the chart above?
- We can go ahead and remove it by unchecking the box and clicking Apply again.
- You’ll notice the time stamp has now disappeared from the display.
- As another example, let’s check the box next to Prior Close followed by Apply.
- Here’s the horizontal line indicating the closing price of the previous session.
- To see the many different choices available, try selecting other boxes and using the Apply button and notice how your chart display changes.
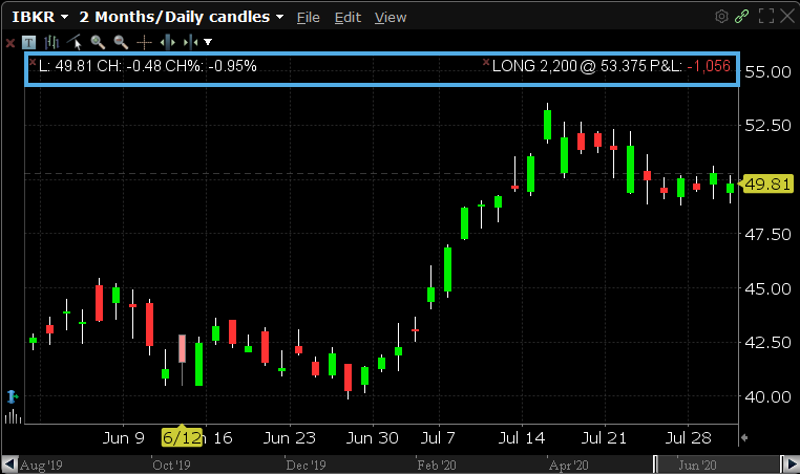
Quote Zone
Let’s advance a little to show you how to add a Quote Zone and then determine what contents can be displayed.
- First, let’s turn on the quote zone by checking the checkbox and locate it on the chart as we have done before.
- You can determine which items to include in this field.
- To do this, we’ll locate the Quote Zone in Global Configuration like we did for Settings by selecting it from the panel on the left.
- When you do, you should see two columns: The Shown Columns to the left and the Available Columns to the right. In the middle section, you can select and deselect from one column to the other.
- Let’s expand Prices and select Mid. Click the add button and now it appears in the shown columns list. Let’s see it in the chart by clicking apply.
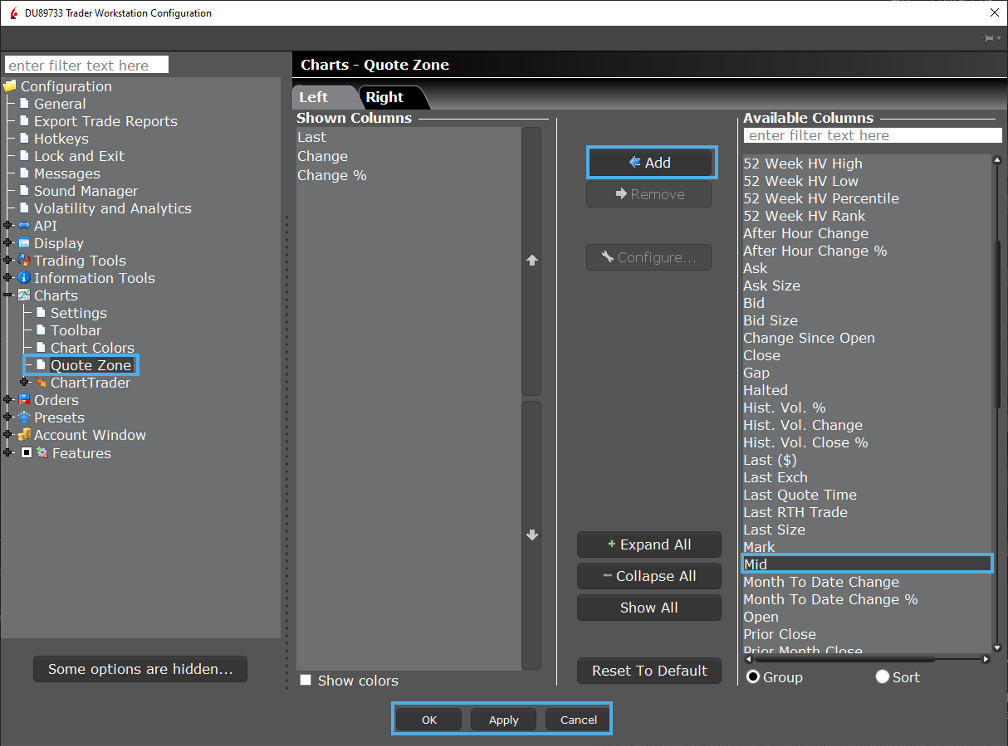
- Above the Shown Columns are Left and Right tabs, which govern the displayed data on either side of the chart.
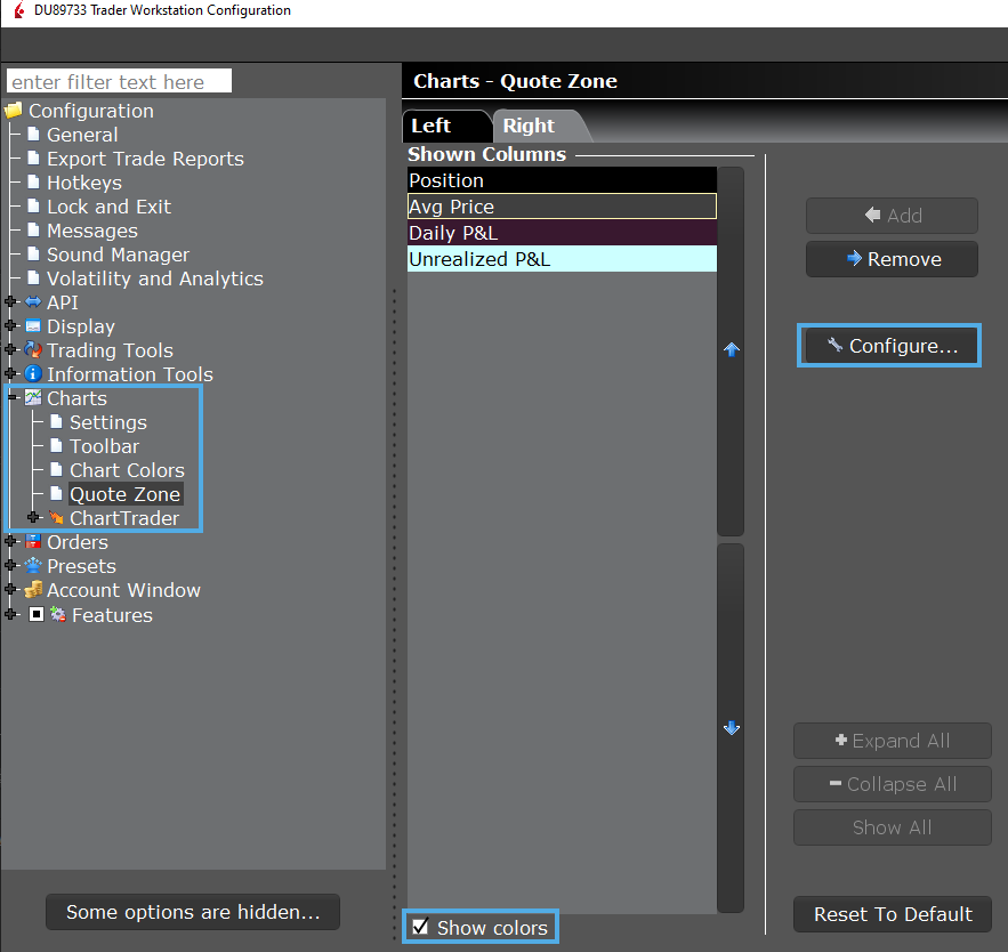
- Notice that at the bottom of this column is a check box for Show Colors. When selected, the chosen value will display as it would on the chart. Here, the data appears as white font on black background.
- If I flip to the Right tab and highlight the Daily P&L cell, I can click on Configure from the center panel and change the text or background color to suit.
- Notice that the alignment can also be altered here, and you can revert to default settings as well.
- Adding data to either tab is easy.
- Either locate from the right column the field you want to add from the local groupings.
- Or you can search. Let’s look for Unrealized P&L and add it to the right column.
- You can also highlight any unwanted detail in the Shown Columns and remove it by clicking the Remove button.
- When you want to see how the changes affect your chart display, just click Apply. Let’s take a look and see the display changes.
- See the P&L with the background color change.
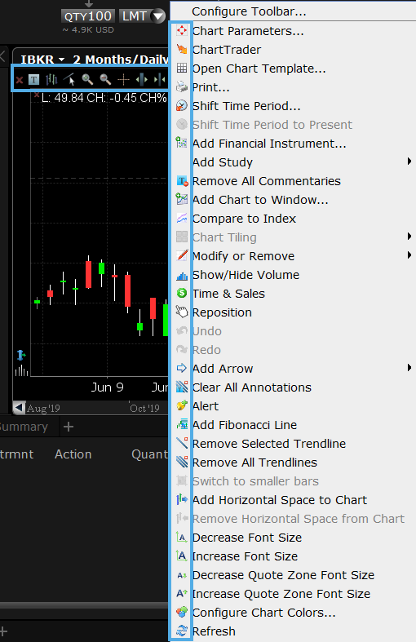
Chart Toolbar Icons
- In this chart display, you can see a set of icons in the upper left, which allow me to click and quickly perform a task.
- For example, clicking the crosshairs icon enables me to hold my cursor on the chart to identify a specific bar and read off from X and Y axes.
- If you don’t see the toolbar icons, just access the View menu and turn it on.
- You can click on the white dropdown arrow to the right of the Toolbar and add more features to the chart, such as volume, and you can completely reconfigure the toolbar too. Let’s try it.
- This will open the Global Configuration window on the toolbar settings.
- You may choose from any of the displayed icons to add to your Toolbar just by placing a check mark next to the feature you want to add.
Let’s click on Add Study and move this icon to the top of the list by clicking Move Up. Lastly, just scroll down the list to see more options. Let’s see the new study icon on the chart on the far left.
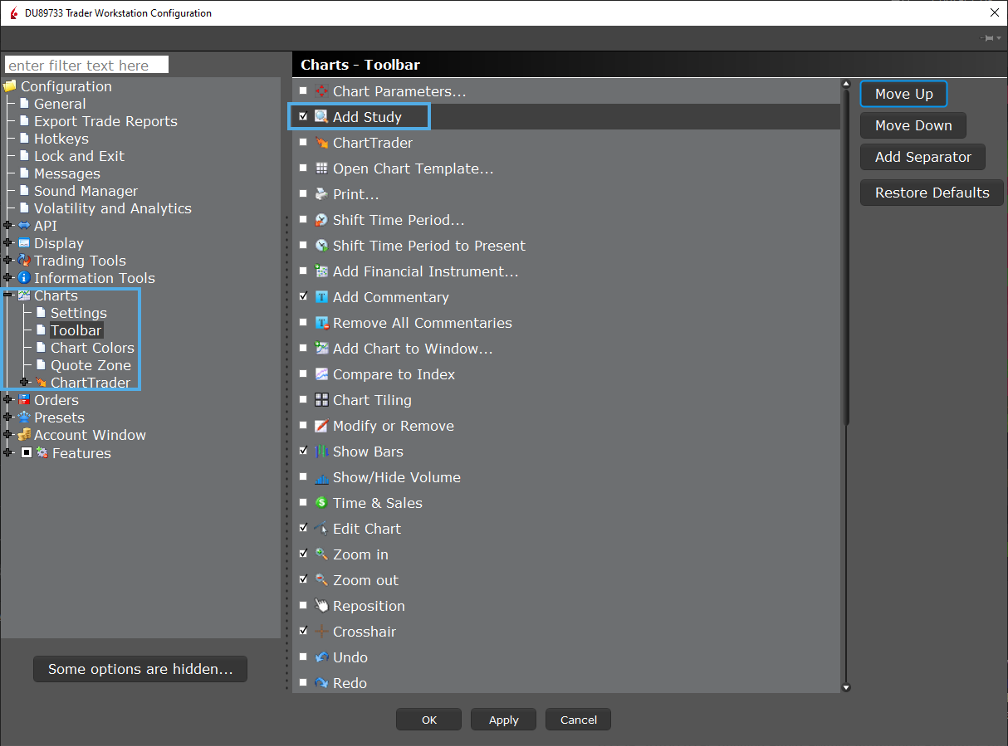
ShortcutTip: The Chart Parameters icon may also be added to the Toolbar. This shortcut enables you to access the Additional data and Features panel quickly.
Likewise, you can add icons to bypass the View menu that provide shortcuts to Add Studies or Show and Hide Volume. Simply check next to each icon what you want to add to your Toolbar. Click Apply and ok to view the changes in the chart.
Chart Colors
Now let’s explore how to manipulate Chart Colors, the final selection in Chart Configuration menu. Here there are two tabs – General and Studies.
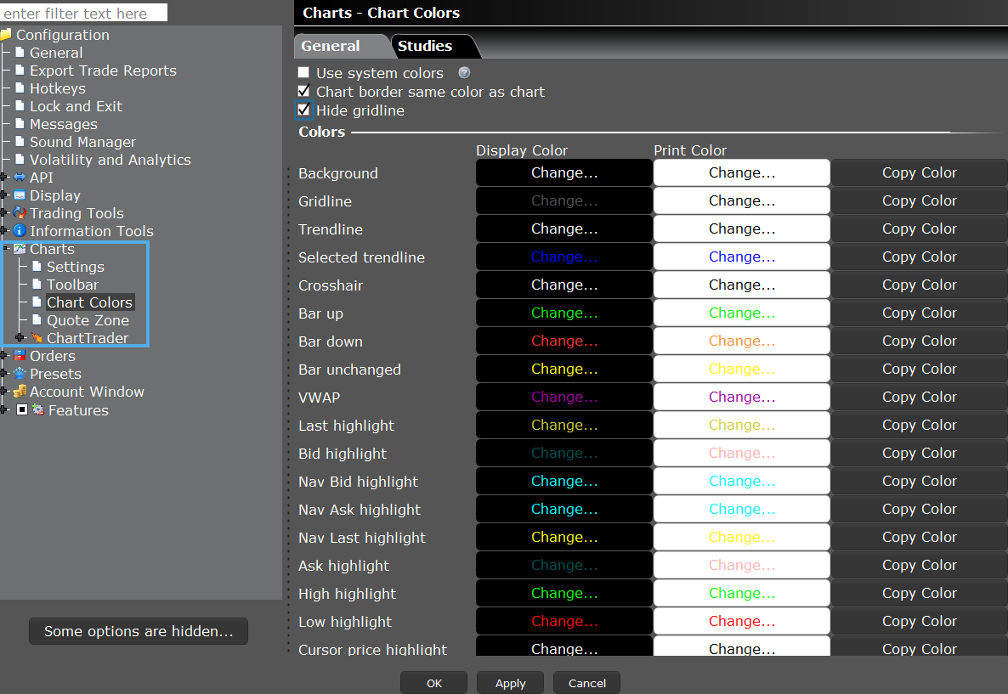
- On the General Tab, all possible display fields are listed.
- The existing color display is shown in the Display Color column, which you can change to any selection on the pop-up palette. Let’s change the Crosshair color to yellow. Click apply and ok and let’s take a look.
- The Print Color column shows how each selection will show when printed using a default white background. Once again, these can be tailored to your choice.
- On the top left the chart gridline display can be turned on and off too.
- Let’s now look at the Studies tab – here, you can color-configure all available technical studies. Click on the ‘Change’ buttons to reveal the palette and switch to the color of your choice. Let’s change the colors of Bollinger bands. Then click apply.
- Now select the Bollinger study from the toolbar icon (white arrow) we previously added and see the new color change.
Now that we’ve walked through the configurable selections, let’s return to the Chart Settings menu and have a look at some additional features.
More Chart Settings
- In Global Configuration in the Layout section, you can select from dropdown menus to determine where the items are positioned on the chart.
- Let’s change the Price axis to left and click apply. You’ll see there are choices available for the time axis, Quote Panel, ChartTrader and more.
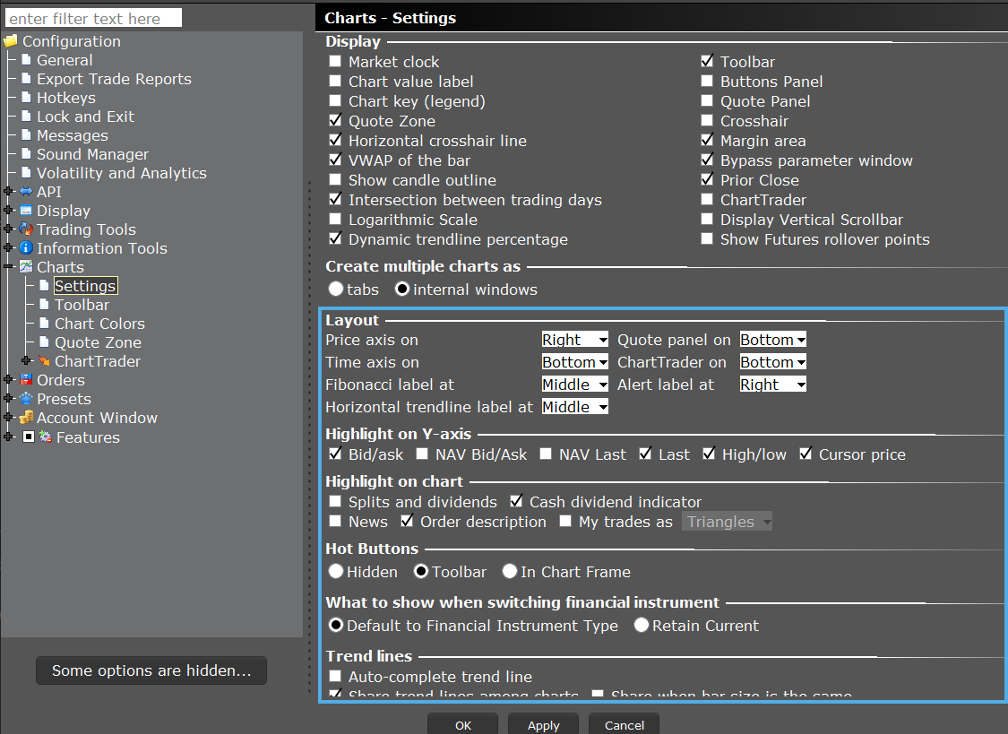
- In my chart, you can see that I am highlighting the Last Price on the Y-axis.
- Below this, you may highlight Bid/ask, high/low and the value for the position of the cursor price, then click apply.
- Stock splits, dividends and news can also be added on a chart by clicking these selections.
- And under Trend lines you can choose to Auto-complete lines and Share trend lines on charts with the same ticker.
- Below that, check the Custom Font Size and adjust the size of the font if you wish to do so.
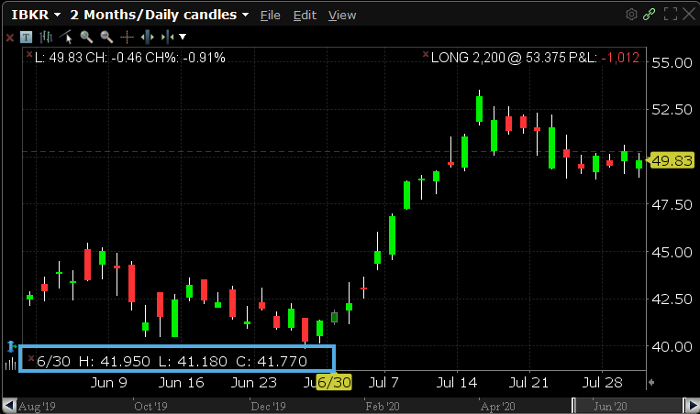
- Under the Tool Tips section, there are three ways to display the values behind the data. One in Tooltips, two in a separate window or three in a Bar Detail Zone.
- Let’s start here and click the radio button. Appearing below is a series of check boxes that determine what will be shown in each of the display choices above.
- These include open, high/low, date, VWAP and importantly, study data. Let’s add volume and click Apply.
- Next, from the View dropdown menu ensure that the Bar Detail Zone is selected. Look at the bottom left of the chart to see volume added.
Now let’s select Display in tooltip and click Apply. When the cursor is held over a specific bar, a pop-up will appear containing the menu items that are selected.
Finally, if you select Display in separate window and then hover the cursor above a bar on the chart, a popup box will appear with the data for that selected date.
You may view or confirm the position of the cursor by reading from the yellow label at the bottom of the chart on the x-axis. This will move with your cursor, but when held still, will confirm the date or time is consistent with the content of the Tool Tip box.
Graphical Position Indicator
You may also graphically display positions in most instruments.
While P&L can be displayed as values as described earlier; the Graphical position indicator will show the direction of the position held associated with the entry price.
- To enable this, check the box to Show Position indicator and select from Line, Field or Custom.
- Let’s select custom and choose 50 pixels. This will show a shaded area in the chart indicating your position.
- Note that the chart time frame must reflect the entry price.
- So, if you have held a position for a long time, you may need to adjust the timeframe to Max Line to enable the display.
Take time to review the selections in Settings including those in the miscellaneous area. Use the Apply button to see how these affect the chart display.
There is a lot of material in this lesson, but the most important thing to remember is how to access Global Chart Configuration.
HOW TO RESIZE STUDY OR INDICATOR BOX WITHIN THE CHART WINDOW
Hello Ranjit, thank you for reaching out. We hope this page from our online user guide answers your question: https://www.ibkrguides.com/tws/usersguidebook/technicalanalytics/charts%20toolbar.htm?Highlight=resize%20study%20box