


![[Gamma] Scalping Please](https://ibkrcampus.com/wp-content/smush-webp/2024/04/tir-featured-8-700x394.jpg.webp "[Gamma] Scalping Please")


Study Notes:
In this lesson, you will learn how to easily open a chart and understand the various elements of the display. We’ll also guide you through the chart layout and show you how to access configuration menus and short cuts so that you can quickly set and change a time period on any chart and swiftly add relevant studies.
- Open a chart
- Understand the display
- How to configure charts
- Change time period
- Add studies
When you first open Mosaic, you will see a chart panel appear in the default layout.
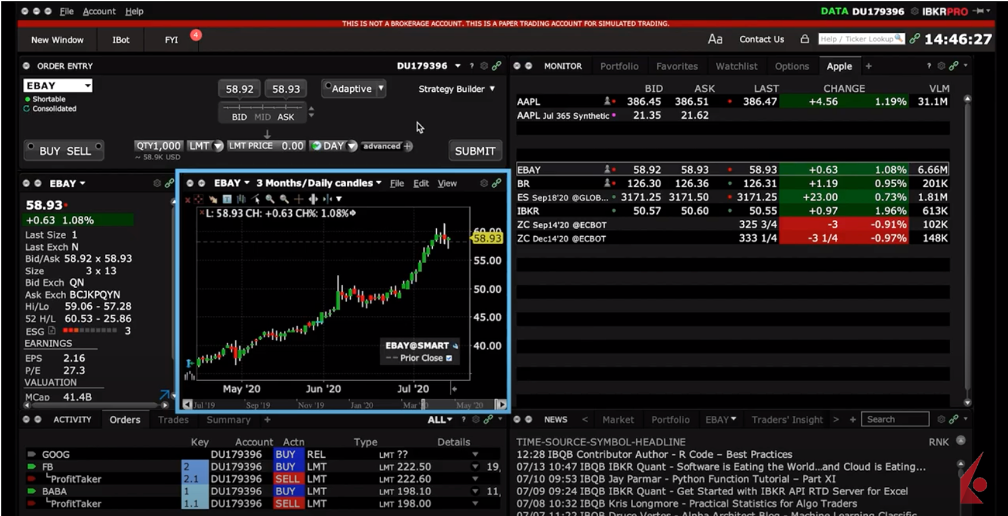
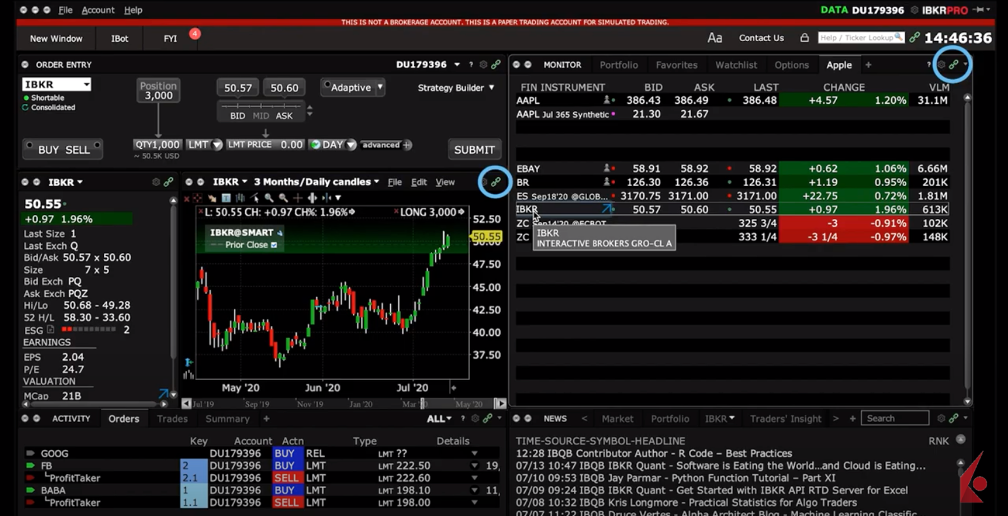
You’ll notice that this chart is color-linked so if I select a ticker from the monitor panel, the chart will update automatically.
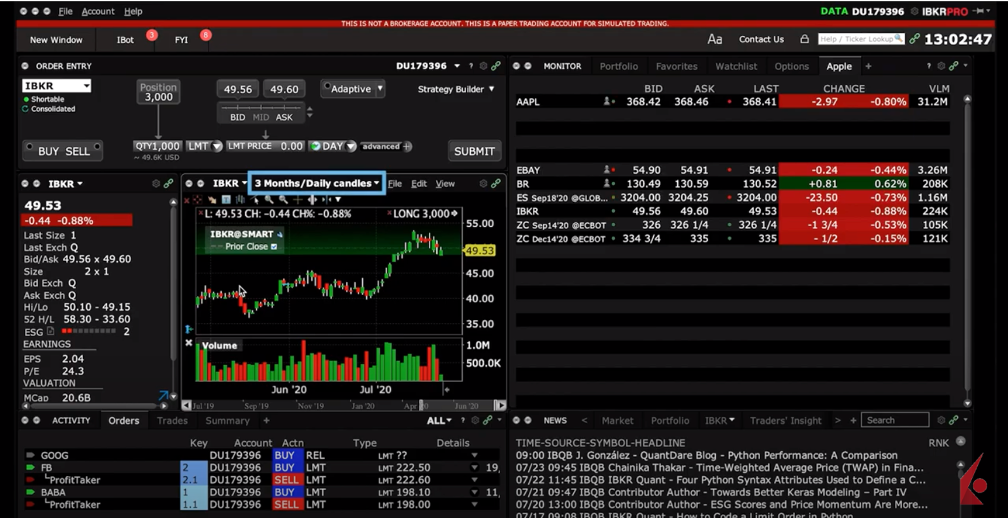
In the title area, you’ll see the ticker and a drop-down menu to select a different ticker, plus a drop-down to adjust the time period of the chart. Let’s select a new time period and see it display.

Price is shown on the Y-axis and time is shown on the X-axis.
This chart panel is completely customizable, and this lesson will show you how to enable or disable chart features.
Opening a chart in Mosaic
Ok to begin – How do you bring up a chart in Mosaic?
There are at least four simple ways to access a chart from TWS Mosaic.
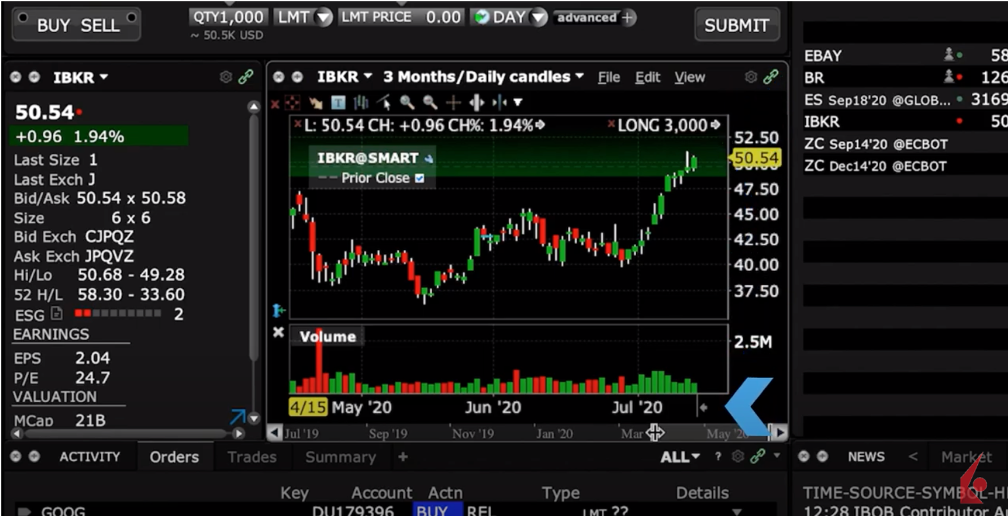
First is the Mosaic chart window – Because of the Group Windows function, clicking on a ticker symbol in any Monitor watchlist will automatically populate the Mosaic chart window. Remember, this chart window is integrated into your Mosaic workspace. While you can enlarge the display by clicking on the expand icon, it can’t permanently be positioned on a secondary screen.
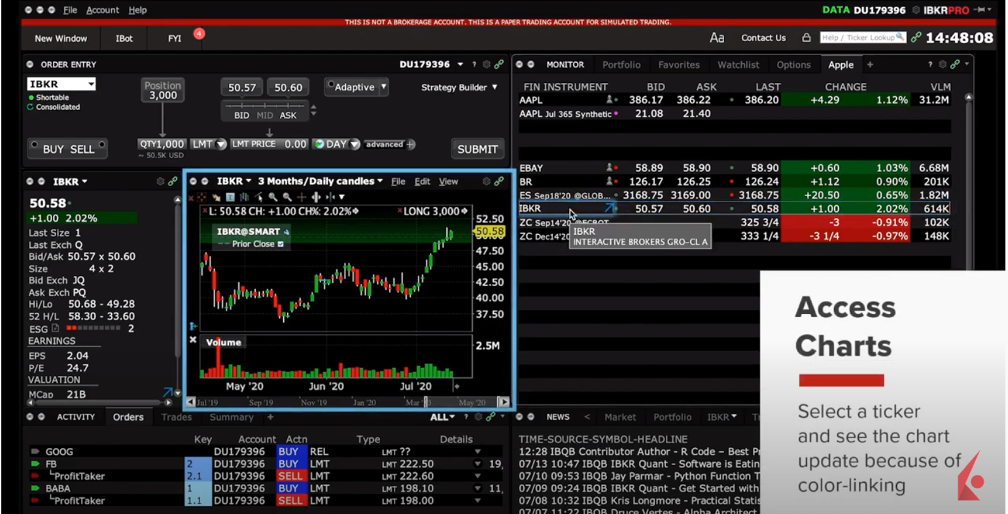
Second is the Floating icon – Click right on a ticker to reveal a floating icon – you may choose the chart icon here to boot up a standalone chart window. This chart can now be repositioned on a secondary screen or left as a standalone chart to refer to in the background.
![]()
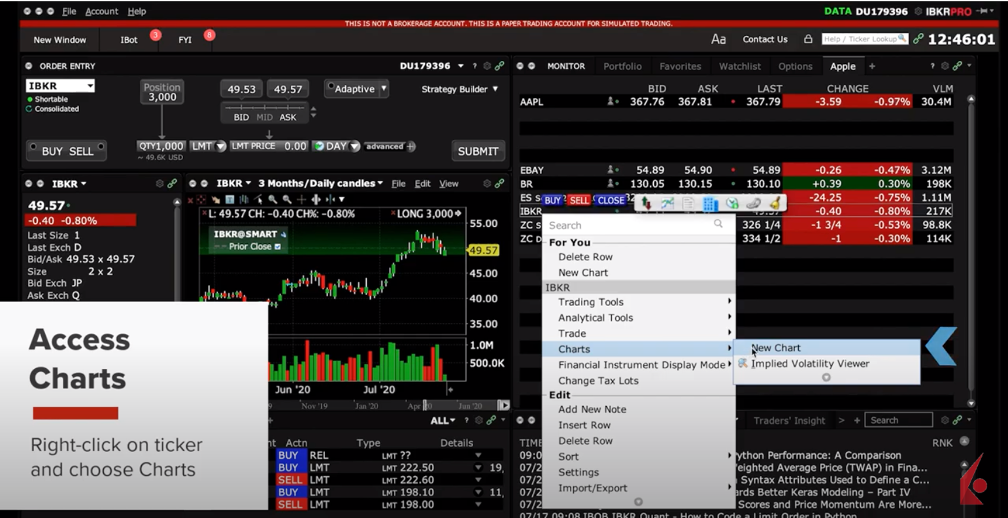
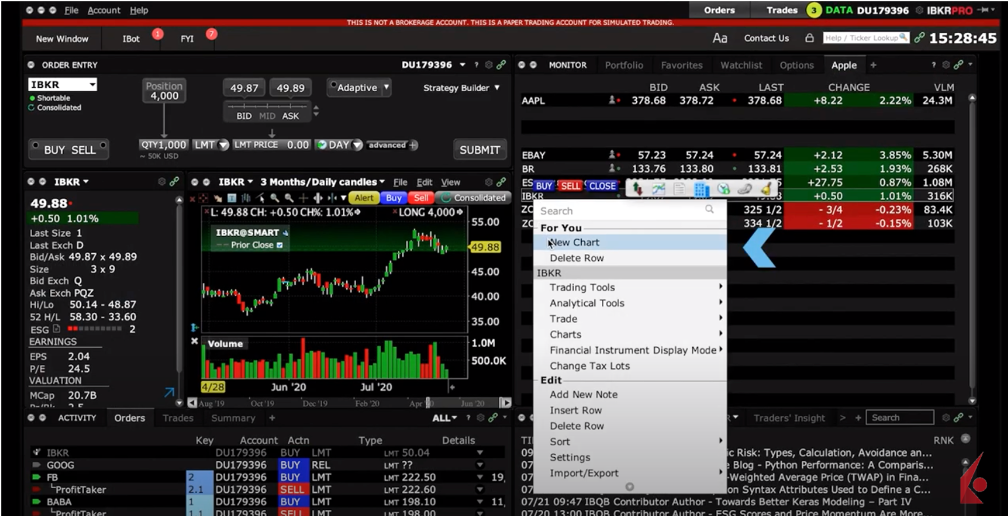
Third is from the Chart menu – Again, clicking right on the ticker symbol will reveal a menu from which you may select Charts, then New Chart from the next pop up box. Again, this is a separate display, which may be positioned on a different monitor.
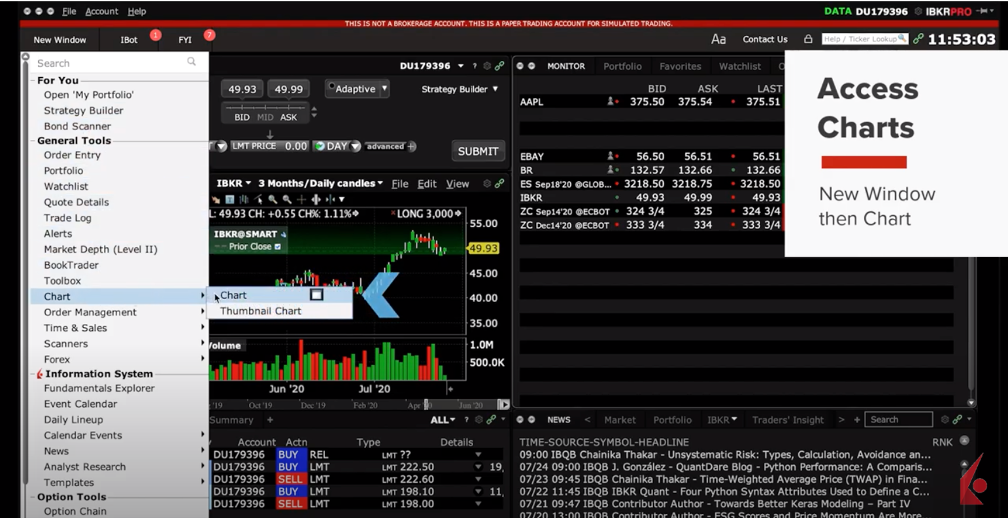
Finally, from the New Window button – Highlight a ticker on screen and use the New Window button in the upper left corner, and under the General Tools category, select Chart, then Chart again.
Understanding the display
Let’s start by selecting a ticker and choosing New Chart.
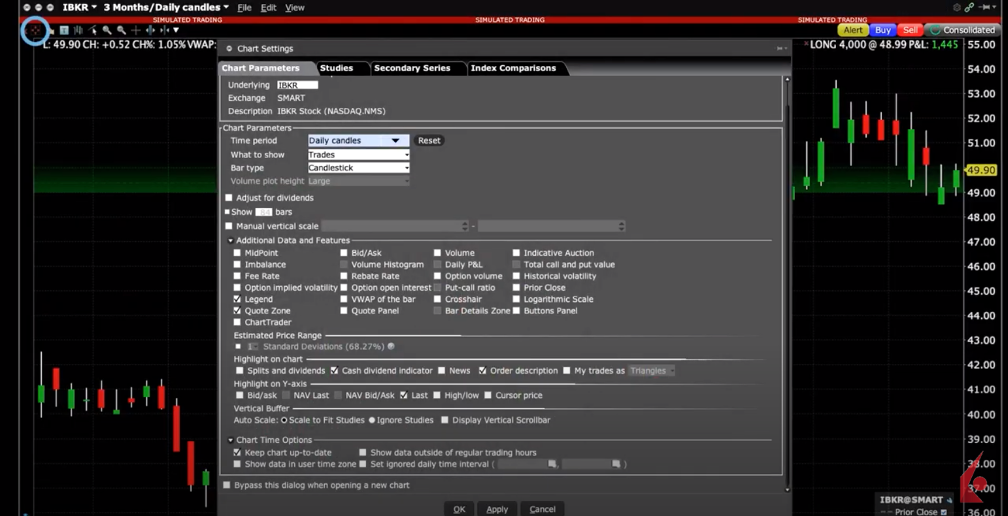
Once you open a chart, you should see the Chart Parameters panel, which later can be bypassed by using the checkbox at the lower left.
If you have already bypassed this panel, you can always return to it via the Edit dropdown menu and by selecting Chart Parameters.
Configuring charts
Chart Settings enables you to do many things, so let’s take a quick tour of the layout of the panel. Remember, whatever you check here will be reproduced in any chart until you make a change.
At the top of the panel you will see four tabs:
- Chart Parameters, which allows you to determine the display content for the underlying security.
- The Studies tab, which is where you will find a wide variety of technical studies to add to the display.
- Secondary series, which you can use to compare your underlying instrument to another or compare to a variety of index values.
- Index comparisons, which you can use to compare with indexes and even add custom indexes to your list.

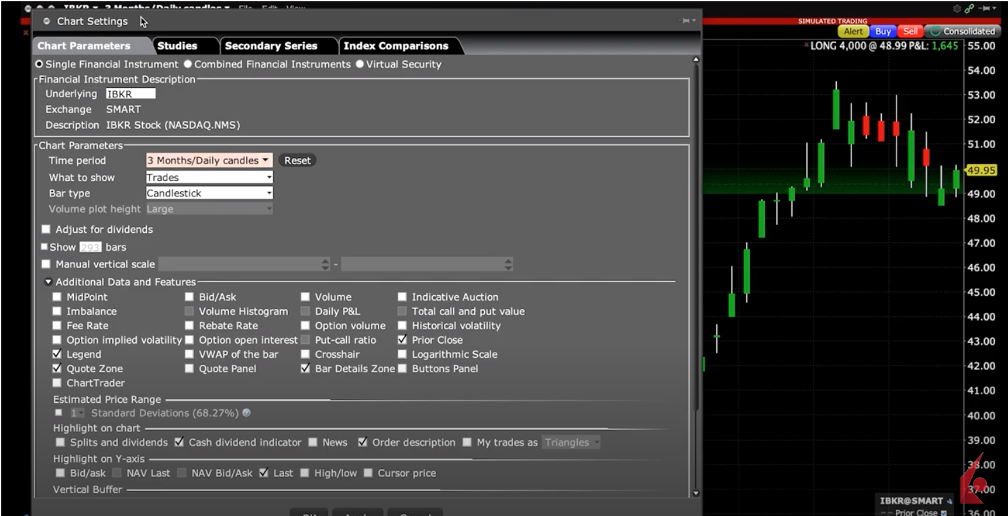
Since charting a single security is one of the most popular reasons behind using TWS Charts, let’s use this as our starting point on the Chart Parameters tab.
You will notice there are three buttons across the top of this panel:
- A single financial instrument
- Combined financial instruments; and
- Virtual securities – an example of this might be the quotient of two competing stocks.

For a single ticker, if the underlying entry field is not already populated you can do so here – select Stock and SMART for destination.
Below, determine the time frame and frequency for what you want to display. You will see that there are two colored boxes – above in blue is the Bar or Candle Size, depending on what you have selected from the Bar Type drop-down menu. Below, in pink, are more time periods to choose from.
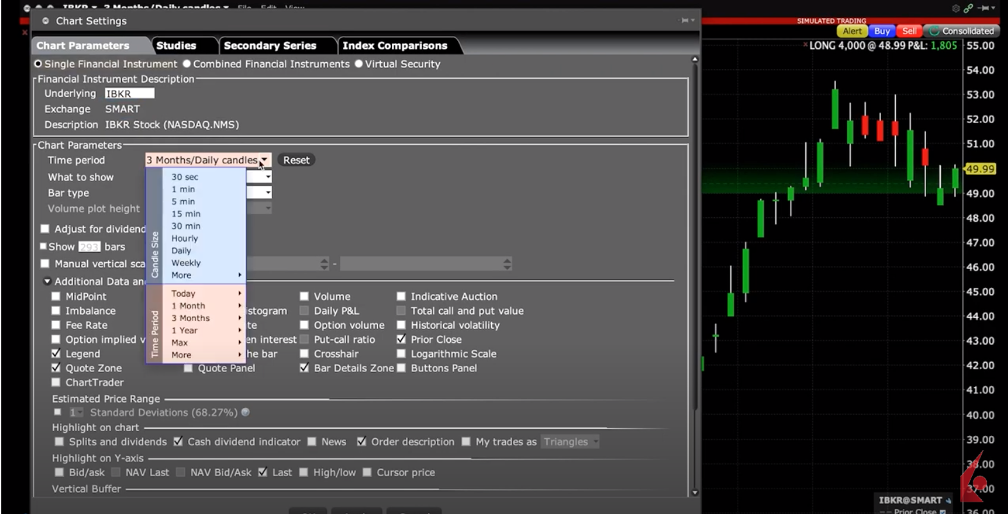
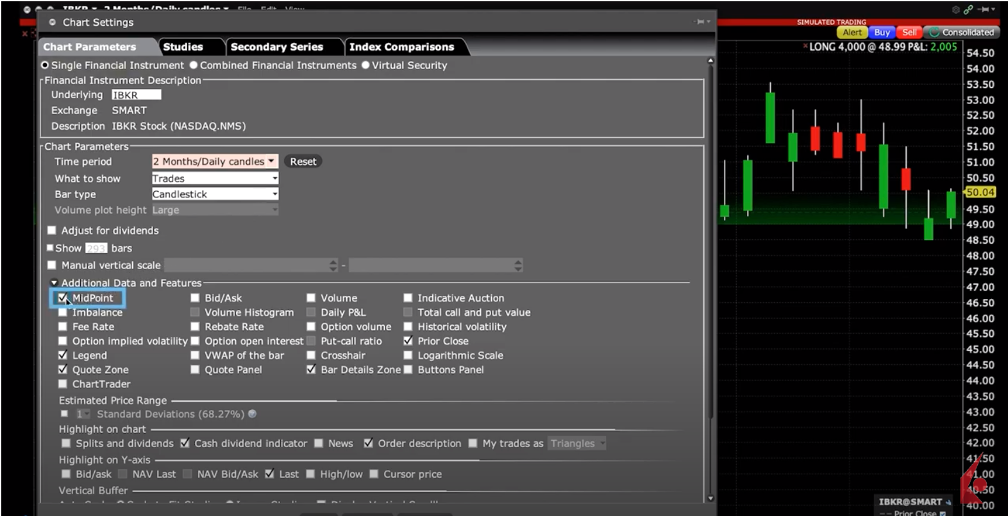
I’m going to select a two-month candle chart and click Apply to view the resulting chart. Note that by clicking Apply rather than OK I can maintain the Chart Settings menu and make additional choices with the box open. If you lose the box and want to reopen it, it is under the Edit menu and Chart Parameters.
For example, if you want to know what the midpoint would look like in your display, select it from the Additional Data and Features section and click Apply. Just deselect if you want to remove it and click the Apply button. You can test several choices to see how they appear and whether you want to retain them in the display.
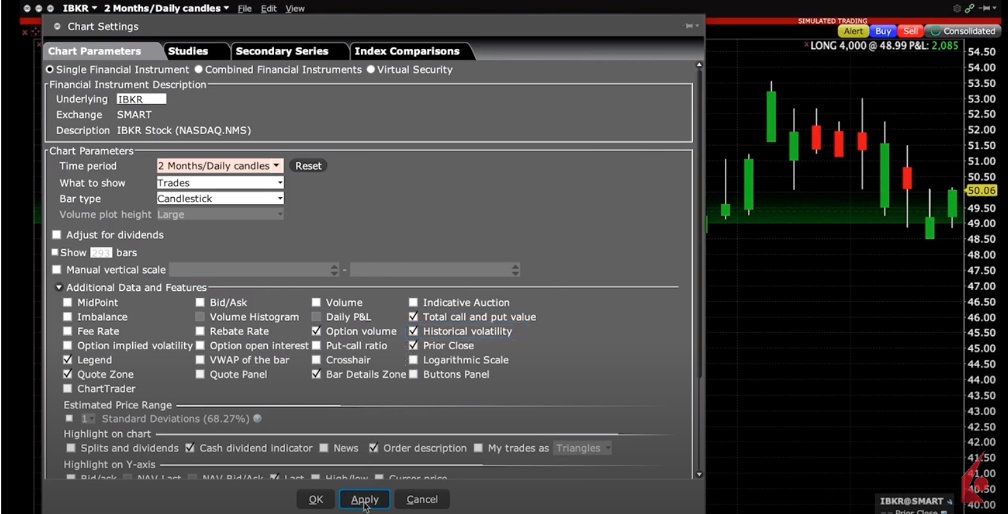
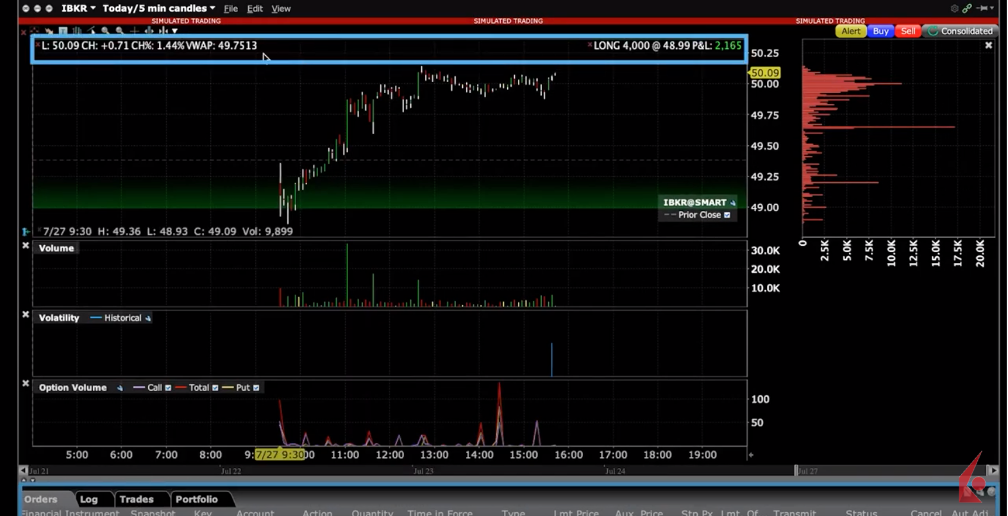
You may notice several boxes are greyed out when the selection does not apply. For example, some options-related data could only be shown on the display when selecting the option price data. You may display option volume broken out into call and put values by underlying, and you can also display historic volatility for a security and the associated implied volatility derived from its options on the same display.
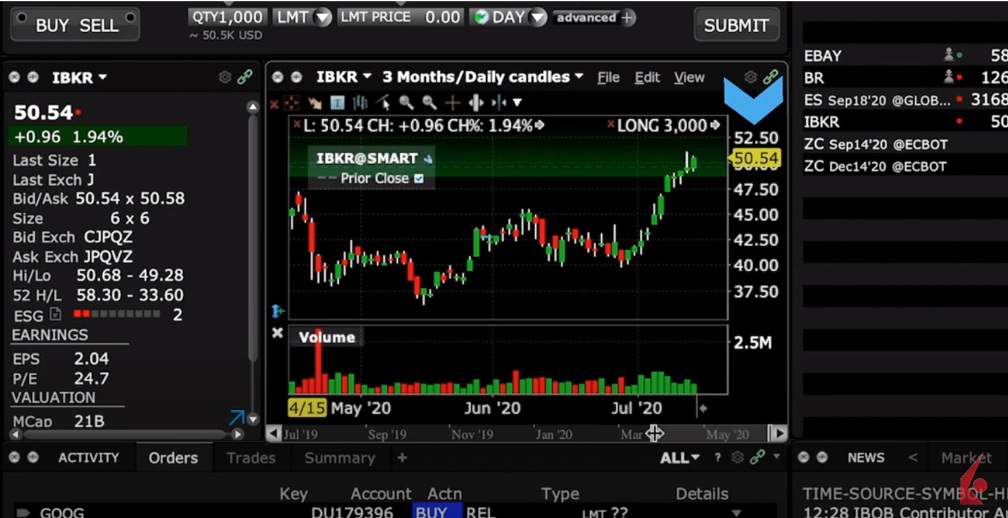
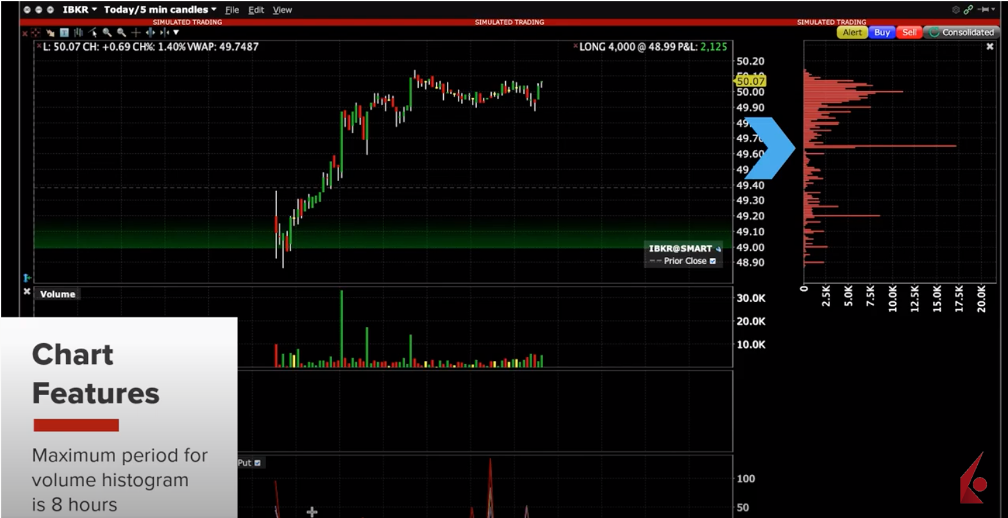
Note that there are two references to Volume for your display. Selecting Volume will include volume bars below the chart from intraday to the maximum history TWS will allow. However, the selection for Volume Histogram is only available for intraday time frames and will display as a stack to the right of the chart. The maximum period supporting the Volume Histogram is 8-hours.
Remember, if you make any selections here TWS will remember your choice for future charts.
We will discuss the Quote Zone and Bar Details Zone in a later video when learning how to configure your charts but note for now here are these selections on this panel.

Also notice that there is a selection for ChartTrader. This can be enabled in order to make trades directly from charts. Let’s turn them on so you can see them display in the chart.
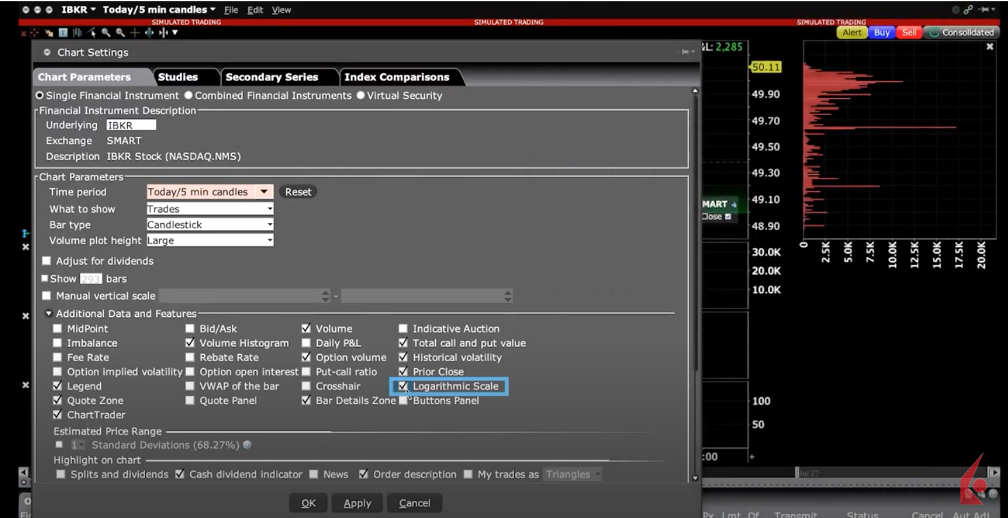
Another useful feature is the Logarithmic Scale selection. This will be of most use when examining charts displayed over longer time periods or with a larger price range. Let’s adjust the time period to 1 Year and click apply. Log charts try to common size the price scale to keep price movements comparable.
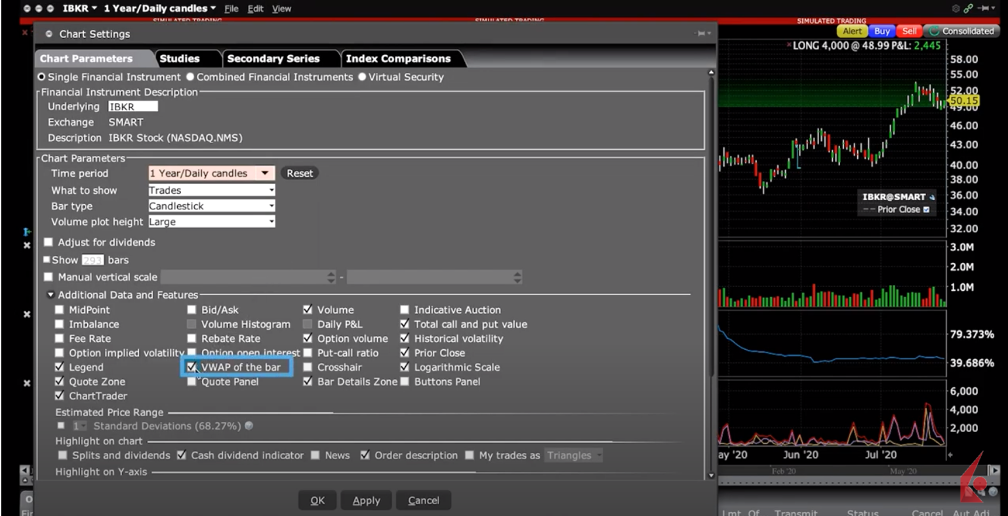
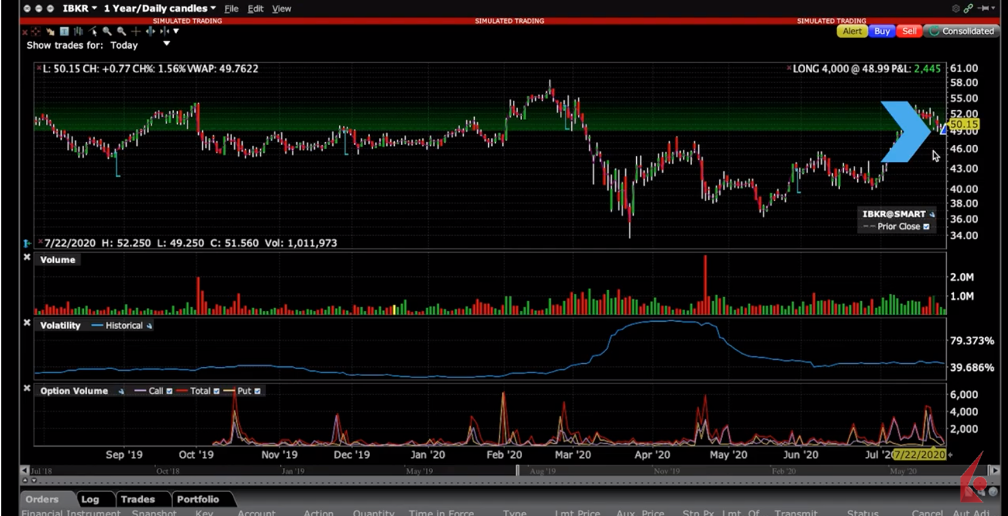
You may add VWAP to price bars from the Additional Data section, and from the Highlight on Chart selections you may highlight your own trades within a bar as Dashes or Triangles to help more easily identify your entry and exit points over time. See the Triangle appear.

Back on Chart Parameters, in the line below, users can determine what values may be highlighted on the Y-axis, such as bid/ask, high/low or last prices or the value associated with the position of the cursor. Let’s highlight high/low and click apply.
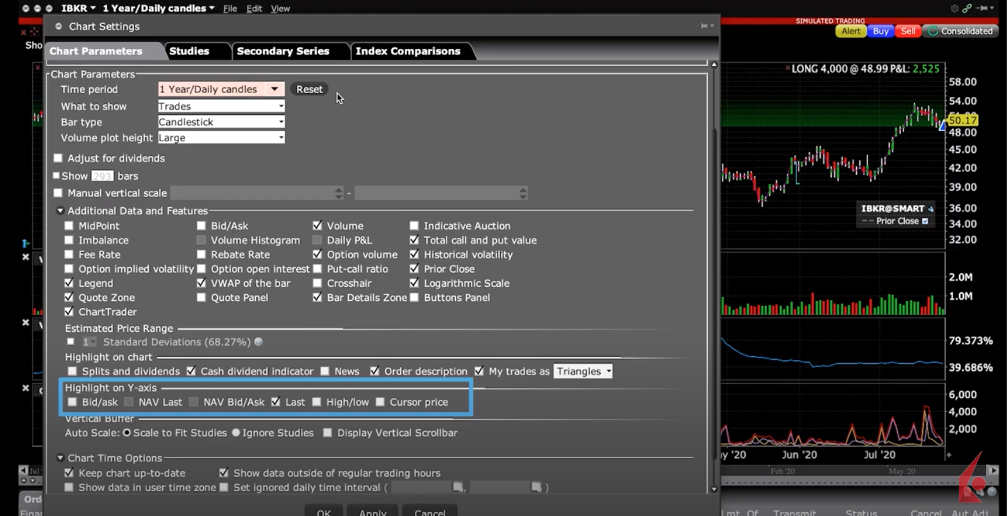
See the highlighted colors display over here on the Y-axis.

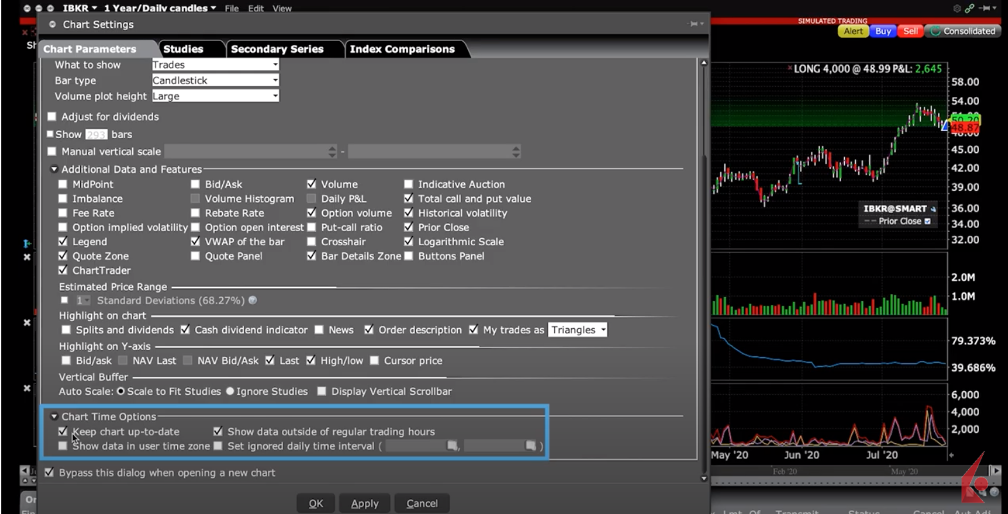
At the bottom of the Chart Settings display page are Chart Time Options. You will probably want to keep your charts up to date, but also show data outside of regular trading hours. Note that this is very useful when watching stock index futures that have multiple overnight or intraday sessions.
While there is a lot more to configuring TWS Charts you should now have a better understanding of the various ways you can open a chart, as well as how to locate and drive display choices from the Chart Settings menu.
Now that you we have covered basic chart configuration, let’s turn our attention to the next lesson on charts in Traders’ Academy.
I want 78 minute candles can you help?
Hello Amit, thank you for reaching out. At this time, 78-minute candles are not available. You can view the current available candle sizes by clicking Charts> New Charts> Click the candle size in the upper left corner> More. We hope this helps!
how can I set a chart default to see larger (vertically) candlesticks
Hello, thank you for reaching out. You can edit charts to see larger candlesticks in TWS by clicking the Candles button in the upper left corner and picking your desired candle size. You can set a custom chart as default by clicking the File menu> save Chart Template As… > and Assign a name. Please be sure to save your chart template. Next, open a new chart and click the File menu followed by Open Chart Template. You can check the option for Set as a default next to your previously saved chart template. We hope this helps!
How to change the order of the studies in the chart?
Hello, we appreciate your question. At this time, it is not possible to change the order of the studies in the chart.
Please explain the parameter: What to show. Thanks!
Robust charting features are available across IBKR’s trading platforms. The overview article has details on the charting capabilities of each platform to help you decide which one meets your needs. Let me know if you have any other questions!
Hello, in any Chart I have configured “keep chart updated” in the parameters. The candles do mostly auto-update, the Bollinger Bands never. What can I do?
Hello Ulf, thank you for reaching out. Please submit a web ticket for this inquiry so our team can investigate and provide you with a detailed answer: http://spr.ly/IBKR_CreateWebTicket
Thank you, issue solved. They told me to replace SMA by EMA.