Your Privacy
When you visit any website it may use cookies and web beacons to store or retrieve information on your browser. This information might be about you, your preferences or your device and is typically used to make the website work as expected. The information does not usually directly identify you, but can provide a personalized browsing experience. Because we respect your right to privacy, you can choose not to allow some types of cookies and web beacons. Please click on the different category headings to find out more and change our default settings. However, blocking some types of cookies may impact your experience on our website and limit the services we can offer.
Strictly Necessary Cookies
Strictly necessary cookies are necessary for the website to function and cannot be switched off in our systems. They are typically set in response to actions made by you which amount to a request for services, such as setting your privacy preferences, logging in or filling in forms. While you can set your browser to block or alert you about these cookies, some parts of the website will not work. These cookies do not store any personally identifiable information.
ALWAYS ACTIVE
Functional Cookies
Functional cookies enable our website to provide enhanced functionality and personalization. They may be set by us or by third party providers whose services we have added to our pages. If you do not allow these cookies then some or all of these services may not function properly.
Marketing Cookies and Web Beacons
Marketing Cookies and web beacons may be set through our website by our advertising partners. They may be used by those companies to build a profile of your interests and show you relevant adverts on other websites. They do not directly store personal information, but uniquely identify your browser and internet device. If you do not allow these cookies and web beacons, you will experience less targeted advertising. Our website does not track users when they cross to third party websites, does not provide targeted advertising to them and therefore does not respond to "Do Not Track" signals.
Interactive Brokers Group Cookie Policy
What are Cookies and Web Beacons?
Cookies are pieces of data that a website transfers to a user's hard drive for record-keeping purposes. Web beacons are transparent pixel images that are used in collecting information about website usage, e-mail response and tracking. Generally, cookies may contain information about your Internet Protocol ("IP") addresses, the region or general location where your computer or device is accessing the internet, browser type, operating system and other usage information about the website or your usage of our services, including a history of the pages you view.
How We Use Cookies and Web Beacons
Interactive Brokers Group collects information from cookies and web beacons and stores it in an internal database. This information is retained in accordance with our Privacy Policy. This website uses the following cookies and web beacons:
Strictly Necessary Cookies
These cookies are necessary for the website to function and cannot be switched off in our systems. They are usually only set in response to actions made by you which amount to a request for services, such as setting your privacy preferences, logging in or filling in forms. You can configure your browser to block or alert you about these cookies, but certain areas of the site will not function properly. These cookies do not store any personal data.
Performance Cookies and Web Beacons
These cookies and web beacons allow us to count visits and traffic sources so we can measure and improve the performance of our site. They help us to know which pages are the most and least popular and see how visitors move around the site. All information that these cookies and web beacons collect is aggregated and, therefore, anonymous. If you do not allow these cookies and web beacons our aggregated statistics will not have a record of your visit.
The website uses Google Analytics, a web analytics service provided by Google, Inc. ("Google"). Google Analytics uses cookies to help analyse how you use this website. The information generated by the cookie about your use of this website (including your IP address) will be transmitted to and stored by Google on servers in the United States. Google will use this information for the purposes of evaluating your use of the website, compiling reports on website activity for website operators and providing other services relating to website activity and internet usage. Google may also transfer this information to third parties where required to do so by law, or where such third parties process the information on Google's behalf. Google will not associate your IP address with any other data held by Google.
Functional Cookies
These cookies enable the website to provide enhanced functionality and personalization. They may be set by us or by third party providers whose services we have added to our pages. If you do not allow these cookies, some or all of these services may not function properly.
Marketing Cookies and Web Beacons
These cookies and web beacons may be set throughout our site by our advertising partners. They may be used by those companies to build a profile of your interests and show you relevant advertisements on other sites. They do not store personal information that could identify you directly, but are based on uniquely identifying your browser and internet device. If you do not allow these cookies and web beacons, you will experience less targeted advertising. The website does not track users when they cross to third party websites, does not provide targeted advertising to them and therefore does not respond to Do Not Track ("DNT") signals.
Managing Your Cookie Preferences
You have many choices with regards to the management of cookies on your computer. All major browsers allow you to block or delete cookies from your system. However, if you do decide to disable cookies you may not be able to access some areas of our website or the website may function incorrectly. To learn more about your ability to manage cookies and web beacons and how to disable them, please consult the privacy features in your browser or visit www.allaboutcookies.org.
This website may link through to third party websites which may also use cookies and web beacons over which we have no control. We recommend that you check the relevant third parties privacy policy for information about any cookies and web beacons that may be used.


![[Gamma] Scalping Please](https://ibkrcampus.com/wp-content/smush-webp/2024/04/tir-featured-8-700x394.jpg.webp "[Gamma] Scalping Please")


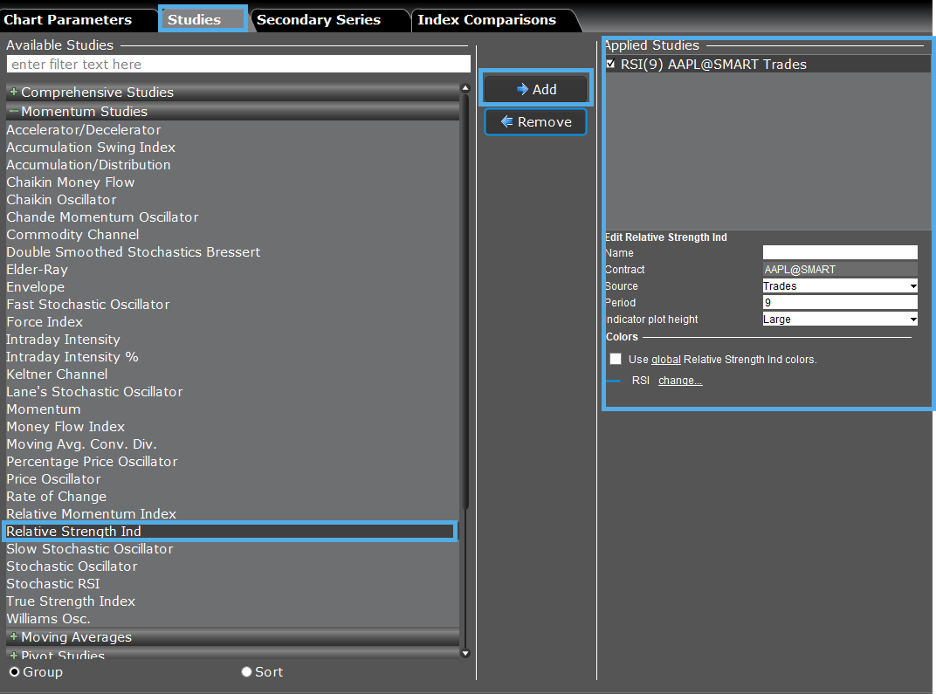
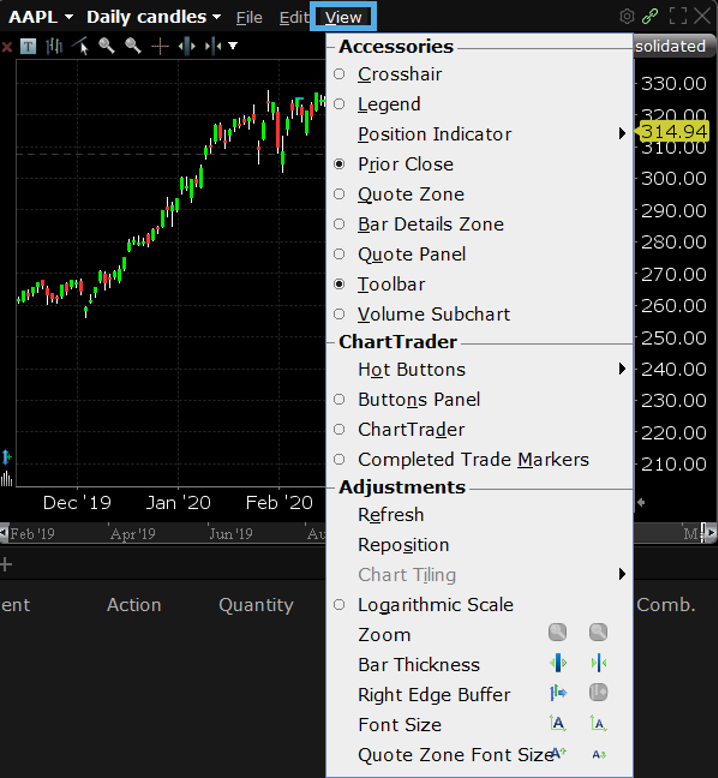
I added MACD, Bollinger bands and Awesome Oscillator to a chart. How to make that permanent to all future charts. When I close the chart window and open another chart window for a different stock, I have to add these studies again. How to make these permanent as default. I do not see the studies in the Global Chart Configuration. Saving as template does not hep either.
Hello Shree, thank you for reaching out. Please view this FAQ for instructions to make a chart the default in TWS:
https://www.ibkr.com/faq?id=64189996
We hope this helps!