


Study Notes:
Now that you’ve learned how to create and configure a single chart in TWS, we’ll now explore how to:
- Create multiple charts within a single chart panel, using different time periods and studies; as well as
- Create chart templates to use saved time periods in the future; and
- Create and save chart definition files displaying different securities.
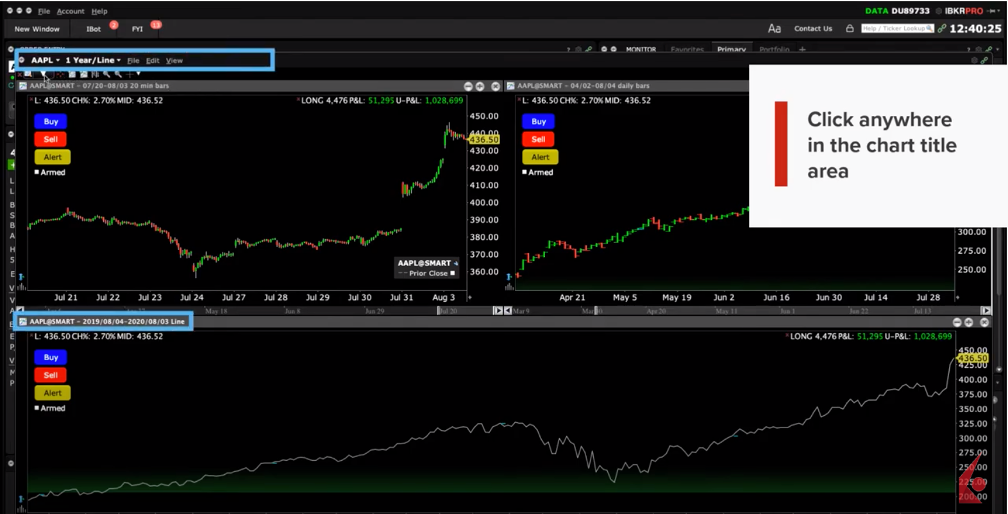
Here’s an example of a multi chart, which I’ll show you how to recreate, and by the end of the session, you should be able to create and customize these multiple charts on your own to suit your trading needs.
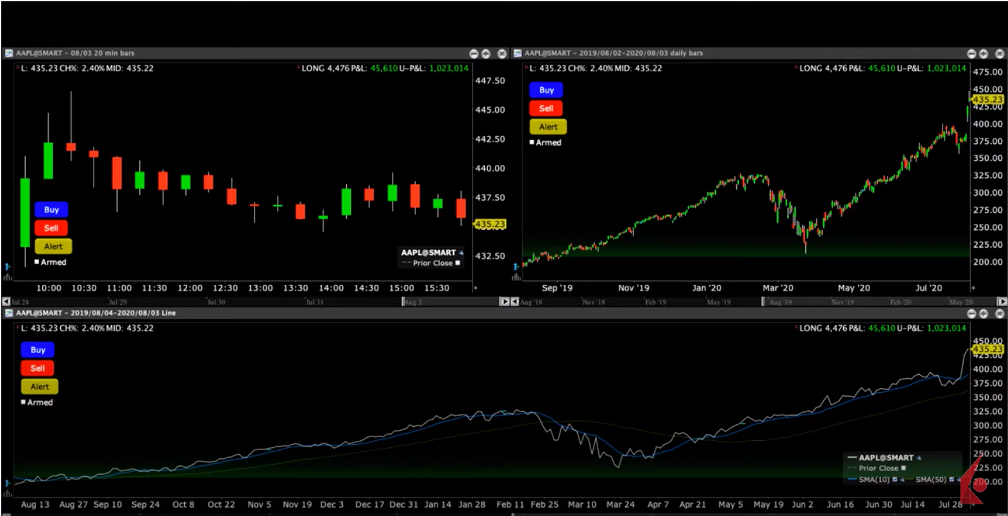
In our example, you’ll see that this chart contains three panels. Across the top are two shorter-term time frames – one in 20-minute candles –
and the other using daily bars.
In the wider lower panel is a multi-month line chart for the same ticker with two simple moving averages beneath the chart.
To create this chart, we’ll use the same starting point from a single security. Choose the chart display icon and if you don’t see this, you can add this icon to your toolbar.
![]()
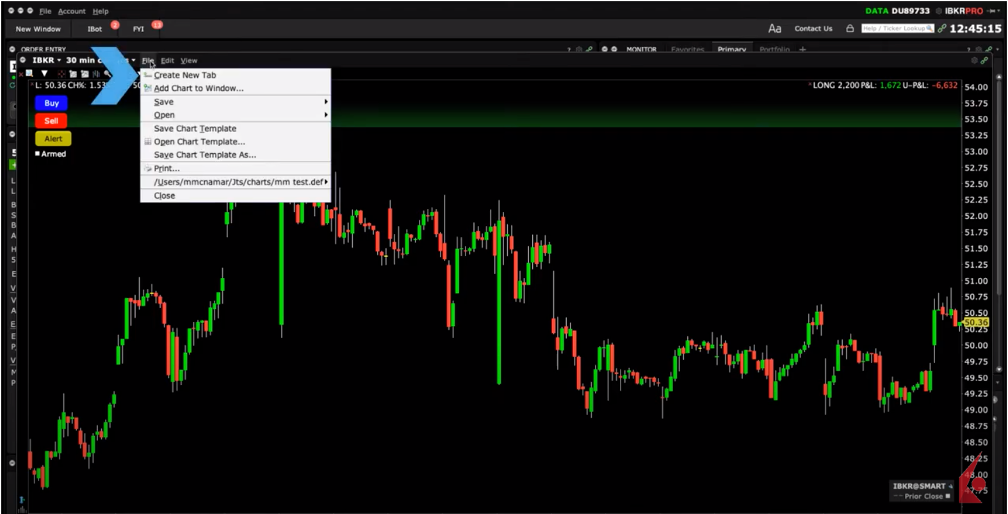
Or, use the File menu to select Add Chart to Window.
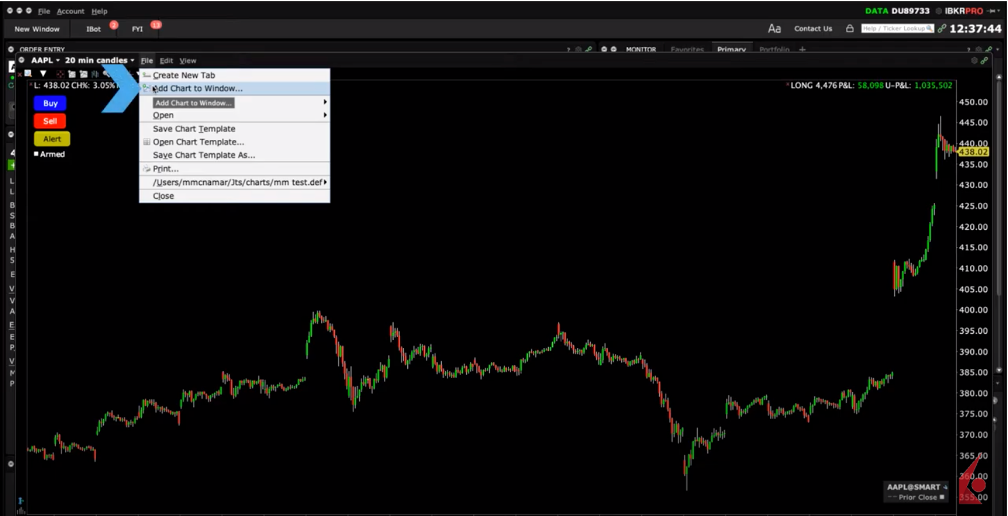
The Chart Parameters dialogue box will appear – click OK. Repeat, but this time I will change the display to request a daily bar chart and one more as a line chart for one year. Click OK. The three charts can be resized just as you would elsewhere in Mosaic by dragging the side of a panel. If you want to remove a chart – just click the X on the top right.
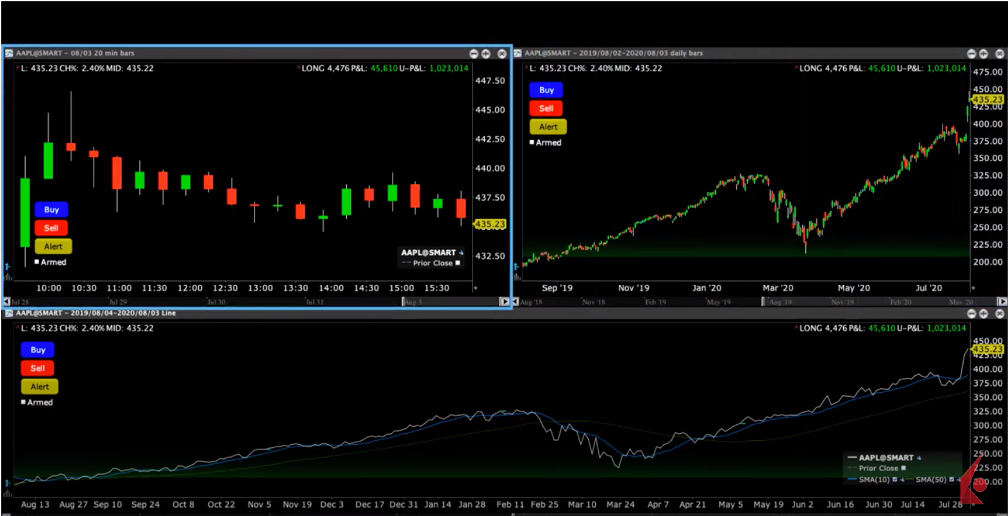
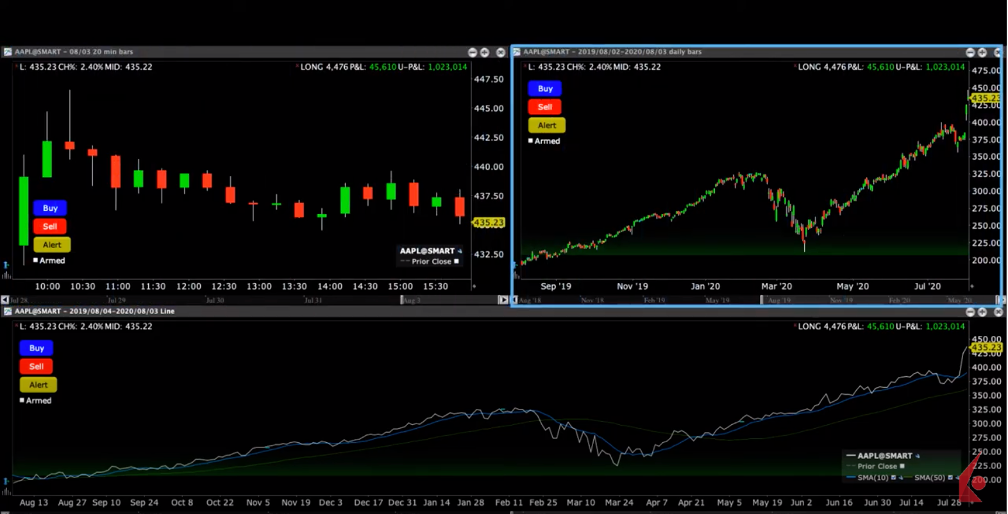
Next, I can change the time period for the two upper plots and switch one from candle to bar. Only one chart can be active at a time, which you can do by clicking in the chart, and when you do, you will notice that the description bar for the security will highlight in comparison to the other panels.
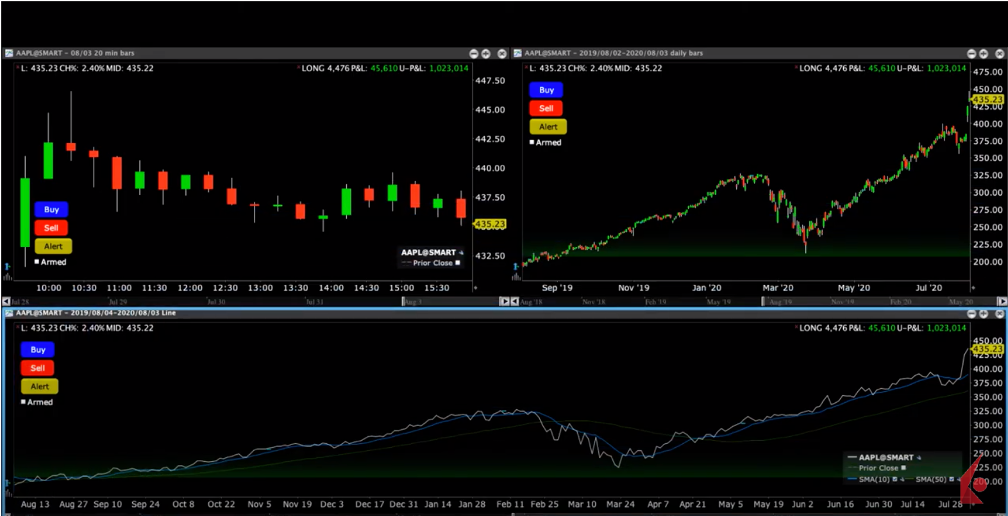
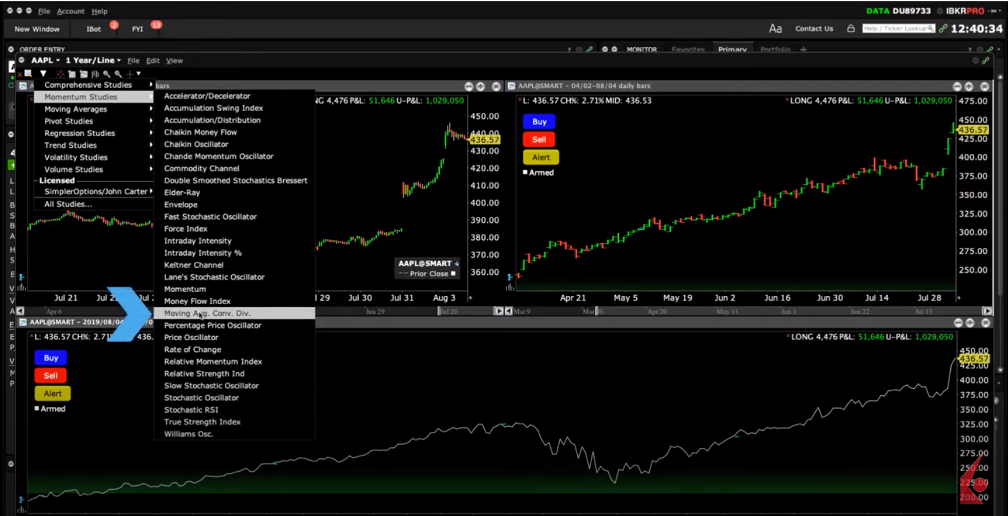
Activate the lower chart, and either use the Chart Parameters shortcut, the Add Study icon or the Edit dropdown menu to access Studies and locate the indicator you wish to display.
Here, I’ll locate MACD and add that. I will also add two simple moving averages and change the period for one of the moving averages and add these to the chart.
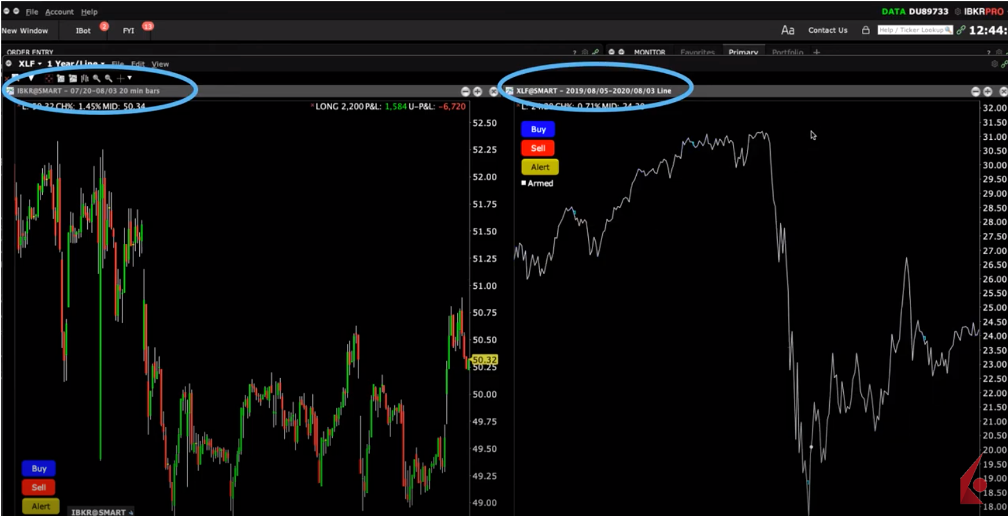
Let’s start again with another single security chart, using the ticker IBKR. Use the File menu to Add a chart. Let’s now enter the ticker XLF for the financial sector ETF. Click OK to add the second chart.
Because you instructed TWS not to rely on the same security, you can now compare different tickers or indices side by side. Again, you can change the time periods for each separately, and you can display bars, candles or lines as you wish.
To maintain multiple securities within a chart and flip between them, you can create a series of tabs.
This can be achieved by, once again, starting with a single security chart. This time, when in the File menu, select Create a Tab.
Input the second ticker into the input field and make your selection. Go back to the File menu, select Create a Tab again and enter a third symbol. You can repeat this process for a set of stocks you wish to monitor. Just click on each tab to return to the alternate display. Plus, you can change time periods as you wish on any chart.
Once you have built your multi chart view or your set of tabs, select Save Chart from the File menu.
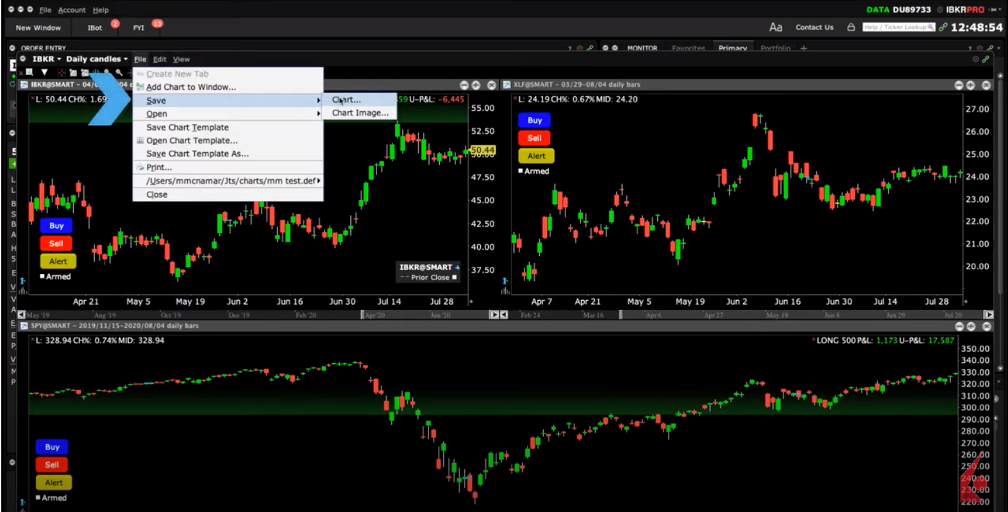
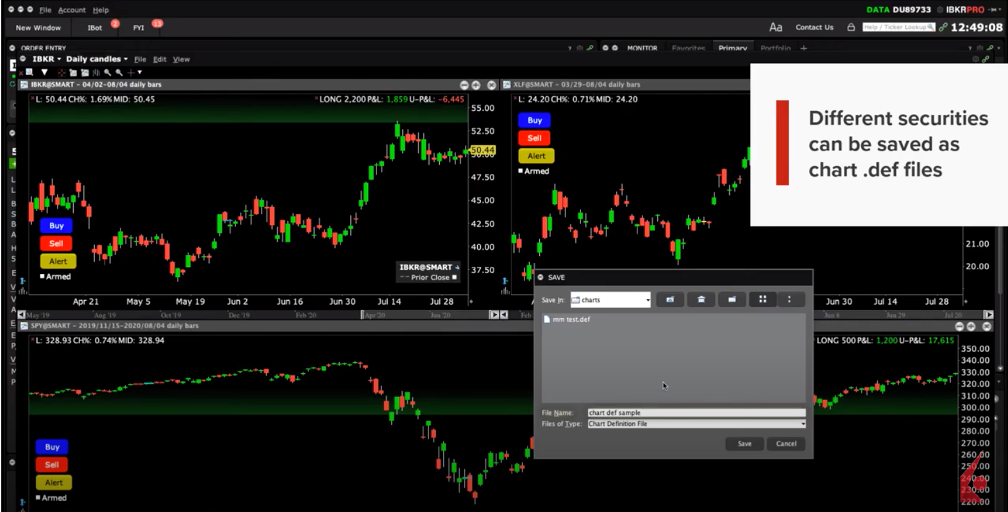
TWS will save as a Chart Definition File with the extension .def, and it will save within the TWS jts folder on your local drive.
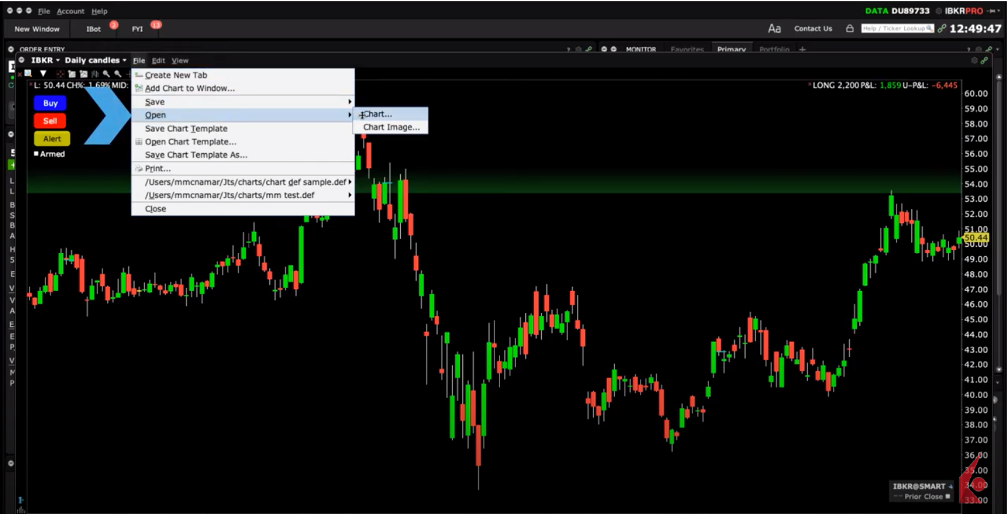
If you leave this saved chart open when exiting TWS, it will relaunch when you next log in. If you close using the red X button in the upper right of the chart, you can always reopen after saving by clicking on the File menu from any chart and select Open Chart.
Let’s start over and create 3 charts for this same instrument at different time periods.
Now, you may also choose to save this as a Chart Template. The advantage of doing so is that you can call up the template and create new charts for additional tickers and then save those charts, too.
The MAIN differences between chart .def files and chart templates are:
- Chart templates must use the same security
- Chart definition files can display different securities
To save this as a template, use the File dropdown menu and select Save Chart Template.
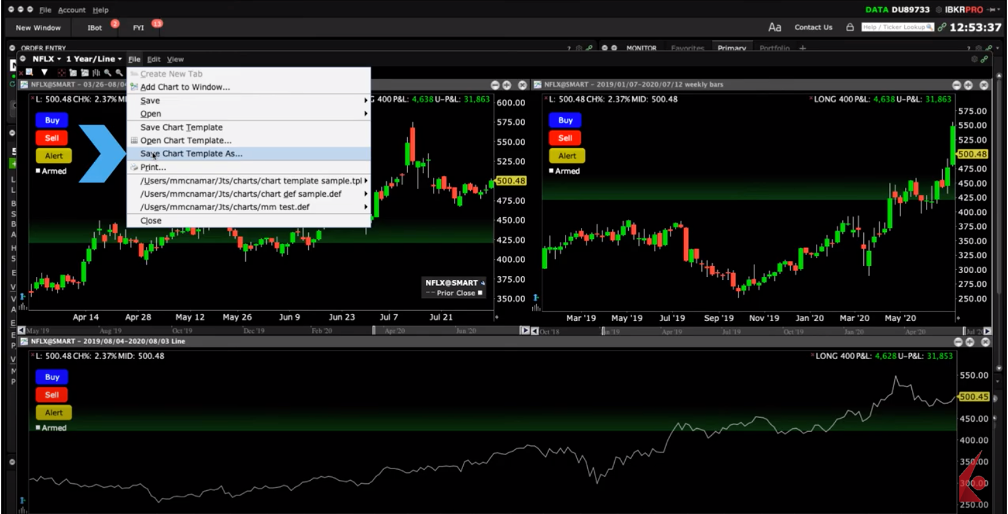
This time your template will be stored in the jts Charts folder, but it will have a .tpl extension which means it’s a Chart Template File.
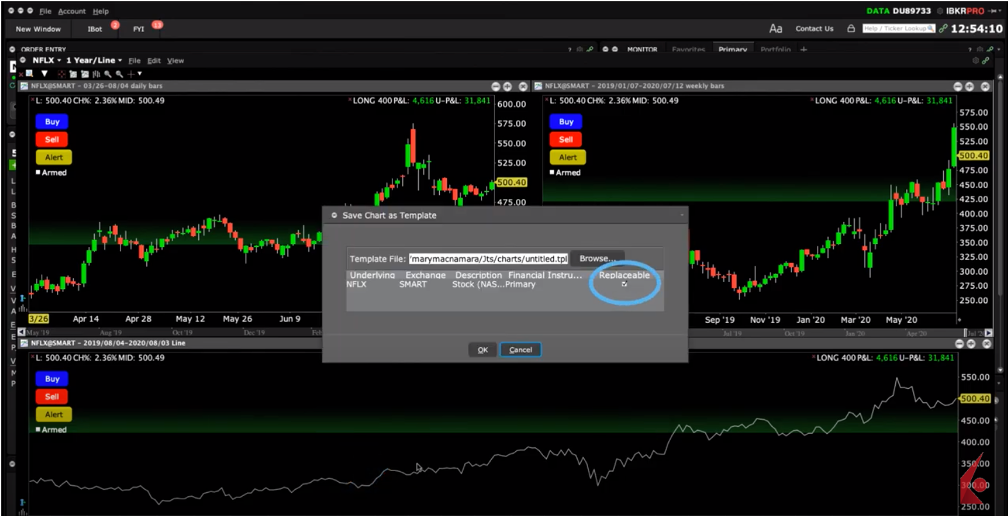
Add a descriptive name in the File Name input field if you wish.
If you want to apply your template settings to additional securities click on the Advanced button and ensure that the check box next to the word Replaceable is checked. You may then load a template with any other security and save as a chart for anytime use.
You should now know how to save charts and templates and how to access them in TWS. You should also now be able to build windows containing multiple charts, understand how to add studies, as well as alter time periods for each.
With that, let’s turn our attention to the next charting lesson in this Traders’ Academy series.
When I open a new chart it does not stay on the main page but opens as a separate tab. Then resizing the chart is not possible because parts of the chart get swallowed. Nice video in theory, but not much help at all.
Hello, thank you for reaching out. In TWS Mosaic, please click File> Add Chart. This automatically adds the charts embedded and not outside or as a tab. We hope this helps!