


1/ Puts Over Dividends
2/ VIX Signaling Worry
3/ Losing the Appetite
Investopedia is partnering with CMT Association on this newsletter. The contents of this newsletter are for informational and educational purposes only, however, and do not constitute investing advice. The guest authors, which may sell research to investors, and may trade or hold positions in securities mentioned herein do not represent the views of CMT Association or Investopedia. Please consult a financial advisor for investment recommendations and services.
1/
Puts Over Dividends
Sometimes markets move in ways that are the opposite of normal operating procedure. At such times, when something seems abnormal, it usually spells opportunity because something, somewhere, has to break, and one of the two diverging lines on a chart must soon snap back into place. Today’s newsletter features three such examples.
In the first example, you ask yourself, “What kind of a crazy investment world do you have to live in to see a day where you can make significantly more money selling puts than collecting dividends?” The answer, apparently, is the one we live in now, with interest rates on bonds that outstrip the dividend yield of most stocks on a regular basis.
The chart below compares the Cboe Put Write Index (PUT) with iShares’ Select Dividend ETF (DVY). The former is an index built from a hypothetical portfolio of short-term T-bills and one-month-expiry, at-the-money put options sold on SPX. The latter is an ETF made up of solid dividend paying stocks like Altria (MO), Verizon (VZ) and Pfizer (PFE).
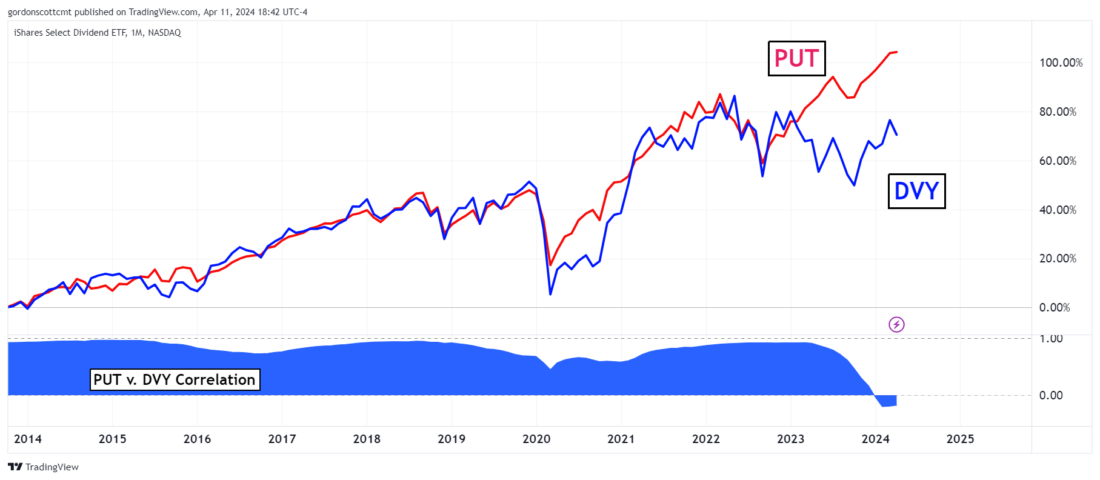
You can see from this chart that these two benchmarks have been close companions, holding better than a 90 percent correlation over the past decade, right up until last year. Except for the highly uncertain times immediately following the Covid pandemic, these two financial instruments have not strayed far from each other.
The wide divergence that has grown over the last twelve months likely has to do with higher interest rates, and the decreased demand investors are showing for dividend stocks. However, it presents a curious case study for answering a single question: how long can this divergence remain before stocks start paying higher dividends, or option traders start demanding to pay lower premiums?
2/
VIX Signaling Worry
When shrewd investors and traders see divergences like the one between put-option prices and dividend stocks, it makes them wonder when the divergence might reverse itself, because that would signal a great opportunity.
Like the divergence between the SPDR S&P 500 ETF (SPY) and Volatility Shares’ -1x Short VIX Futures ETF (SVIX). These securities should mimic each other, because SVIX is an inverted version of the Cboe Volatility Index (VIX). Since the VIX and SPY are often inversely correlated, SVIX should have a positive correlation to each other. In fact they do, at least most of the time. And when they don’t, you should pay attention (see chart below)

3/
Losing the Appetite
Usually the Russell 2000 moves in, roughly, the same direction as the S&P 500 and the Nasdaq 100. Usually the SPDR Utility Index ETF (XLU) does not outperform them. Usually investors tend to be okay with taking on a reasonable amount of risk. That’s how things usually go–until all of a sudden, they don’t go that way anymore.
The chart below compares iShares’ Russell 2000 Index ETF (IWM) with SPY and with XLU. The appearance of this comparison should be enough to make any investor take a pause and consider what is going to give on this chart.

If IWM is a good proxy for the “Risk On” trade, and XLU is a good proxy for the “Risk Off” trade, then why is SPY still rising at a time when XLU is rising and IWM is falling?
All three of these charts suggest that investors might be ready to stop paying top dollar for high-growth opportunities. The savvy trader or investor will want to keep a close watch on these trends.
—
Originally posted 12th April, 2024
Join The Conversation
If you have a general question, it may already be covered in our FAQs. If you have an account-specific question or concern, please reach out to Client Services.
Leave a Reply
Disclosure: Investopedia
Investopedia.com: The comments, opinions and analyses expressed herein are for informational purposes only and should not be considered individual investment advice or recommendations to invest in any security or to adopt any investment strategy. While we believe the information provided herein is reliable, we do not warrant its accuracy or completeness. The views and strategies described on our content may not be suitable for all investors. Because market and economic conditions are subject to rapid change, all comments, opinions and analyses contained within our content are rendered as of the date of the posting and may change without notice. The material is not intended as a complete analysis of every material fact regarding any country, region, market, industry, investment or strategy. This information is intended for US residents only.
Disclosure: Interactive Brokers
Information posted on IBKR Campus that is provided by third-parties does NOT constitute a recommendation that you should contract for the services of that third party. Third-party participants who contribute to IBKR Campus are independent of Interactive Brokers and Interactive Brokers does not make any representations or warranties concerning the services offered, their past or future performance, or the accuracy of the information provided by the third party. Past performance is no guarantee of future results.
This material is from Investopedia and is being posted with its permission. The views expressed in this material are solely those of the author and/or Investopedia and Interactive Brokers is not endorsing or recommending any investment or trading discussed in the material. This material is not and should not be construed as an offer to buy or sell any security. It should not be construed as research or investment advice or a recommendation to buy, sell or hold any security or commodity. This material does not and is not intended to take into account the particular financial conditions, investment objectives or requirements of individual customers. Before acting on this material, you should consider whether it is suitable for your particular circumstances and, as necessary, seek professional advice.


Super commentaires, très pertinent.
Thanks for engaging!