


1/ Top in High Yield Index to Support a Broad Bull Market
2/ China Starts New Bull Market
3/ Precious Metal Stocks Confirming Strength in the Metals
4/ A Better Way to be Long Crude Oil
Investopedia is partnering with CMT Association on this newsletter. The contents of this newsletter are for informational and educational purposes only, however, and do not constitute investing advice. The guest authors, which may sell research to investors, and may trade or hold positions in securities mentioned herein do not represent the views of CMT Association or Investopedia. Please consult a financial advisor for investment recommendations and services.
1/ Top in High Yield Index to Support a Broad Bull Market
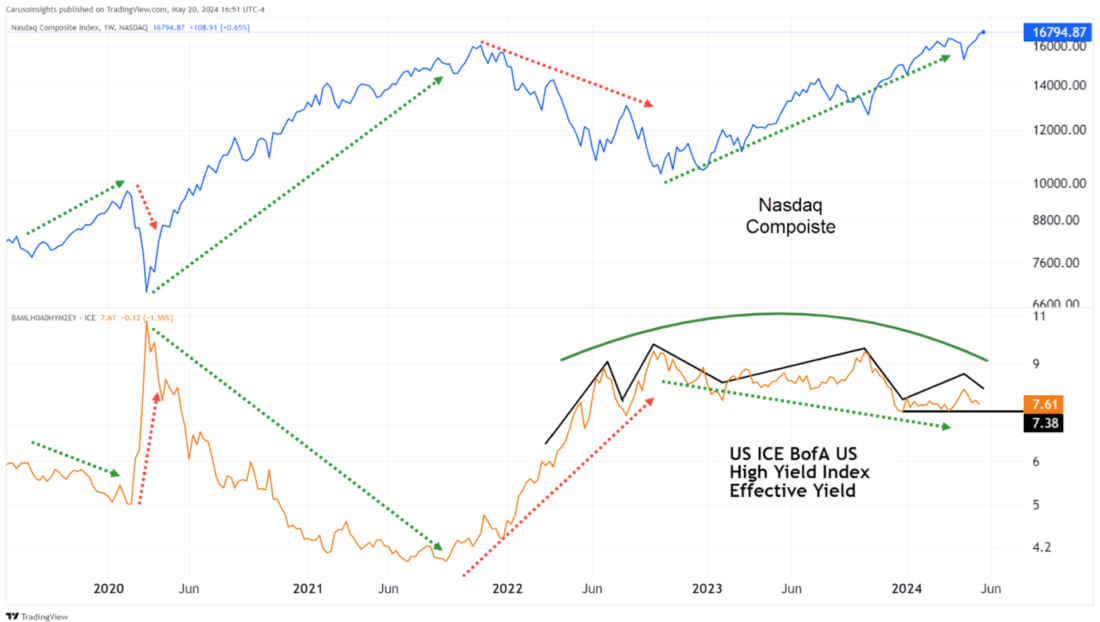
It appears the High Yield index has spent two years building a complex Head and Shoulder top. A break below the Neckline will support stronger and broader stock gains.
2/ China Starts New Bull Market
Similar to the US stock markets, the Chinese Hang Seng topped in 2021 and entered a bear market. Unlike the US markets, its drop has been far more severe, and the rebound has been non-existent—until now.
After successfully retesting the 2022 bear market low, the Hang Seng Index has broken a significant downtrendline with force. This noteworthy move highlights the transition of the Hang Seng Index back to a bull market.

3/ Precious Metal Stocks Confirming Strength in the Metals
Unlike other breadth indicators, net highs/lows provide a reading of a more significant event. Unlike studying advancers vs. decliners, a 52-week high or low requires conviction by the buyer or seller to pay the highest or lowest price of the year.
Therefore, when an index has more stocks making 52-week highs vs. 52-week lows, it indicates conviction by buyers.
As you can see, many net 52-week highs in gold and silver miners have confirmed the recent powerful uptrend in precious metals. This helped identify that the price drop was more than a mere bull trap.

Courtesy of TrendSpider
4/ A Better Way to be Long Crude Oil
Recent advances in copper, gold, and silver have left crude oil investors feeling left out, as it remains in a correction. However, the market is signaling that there may be a better way to invest in a Crude Oil rebound.
As you can see in the chart, Oil Services stock FTI is strongly correlated to Crude Oil. However, investor demand has resulted in the stocks sitting just below 52-week highs despite the pullback in Crude Oil. Given this relative strength, an investor looking for exposure to Crude Oil should consider FTI as a better alternative.

————————————-
Originally posted on May 21, 2024
Disclosure: Investopedia
Investopedia.com: The comments, opinions and analyses expressed herein are for informational purposes only and should not be considered individual investment advice or recommendations to invest in any security or to adopt any investment strategy. While we believe the information provided herein is reliable, we do not warrant its accuracy or completeness. The views and strategies described on our content may not be suitable for all investors. Because market and economic conditions are subject to rapid change, all comments, opinions and analyses contained within our content are rendered as of the date of the posting and may change without notice. The material is not intended as a complete analysis of every material fact regarding any country, region, market, industry, investment or strategy. This information is intended for US residents only.
Disclosure: Interactive Brokers
Information posted on IBKR Campus that is provided by third-parties does NOT constitute a recommendation that you should contract for the services of that third party. Third-party participants who contribute to IBKR Campus are independent of Interactive Brokers and Interactive Brokers does not make any representations or warranties concerning the services offered, their past or future performance, or the accuracy of the information provided by the third party. Past performance is no guarantee of future results.
This material is from Investopedia and is being posted with its permission. The views expressed in this material are solely those of the author and/or Investopedia and Interactive Brokers is not endorsing or recommending any investment or trading discussed in the material. This material is not and should not be construed as an offer to buy or sell any security. It should not be construed as research or investment advice or a recommendation to buy, sell or hold any security or commodity. This material does not and is not intended to take into account the particular financial conditions, investment objectives or requirements of individual customers. Before acting on this material, you should consider whether it is suitable for your particular circumstances and, as necessary, seek professional advice.
Disclosure: Futures Trading
Futures are not suitable for all investors. The amount you may lose may be greater than your initial investment. Before trading futures, please read the CFTC Risk Disclosure. A copy and additional information are available at ibkr.com.


Join The Conversation
If you have a general question, it may already be covered in our FAQs. If you have an account-specific question or concern, please reach out to Client Services.