


1/ AAPL
2/ Bitcoin
3/ IWM Russell 2k ETF
Investopedia is partnering with CMT Association on this newsletter. The contents of this newsletter are for informational and educational purposes only, however, and do not constitute investing advice. The guest authors, which may sell research to investors, and may trade or hold positions in securities mentioned herein do not represent the views of CMT Association or Investopedia. Please consult a financial advisor for investment recommendations and services.
1/ AAPL
As everyone knows by now, AAPL has blasted back to new highs with one of its biggest two-day gains in history. In fact, the +10.3% two-day advance was the biggest since November’22 and the sixth two-day gain of at least 10% since the start of 2009. However, exceedingly strong two-day up-moves of this magnitude or greater have happened dozens of times in its history. In fact, there were 16 such instances between 1999 and 2000 alone.
So, what does this tell us about AAPL’s future direction? Well, for one, we know that this kind of move can’t be sustained. That’s hardly soothing for investors who feel that they missed a huge advance.
Let’s think about it this way instead: AAPL has shown it can (and will) rally from various technical states throughout its history. The last few months are a perfect example of this.
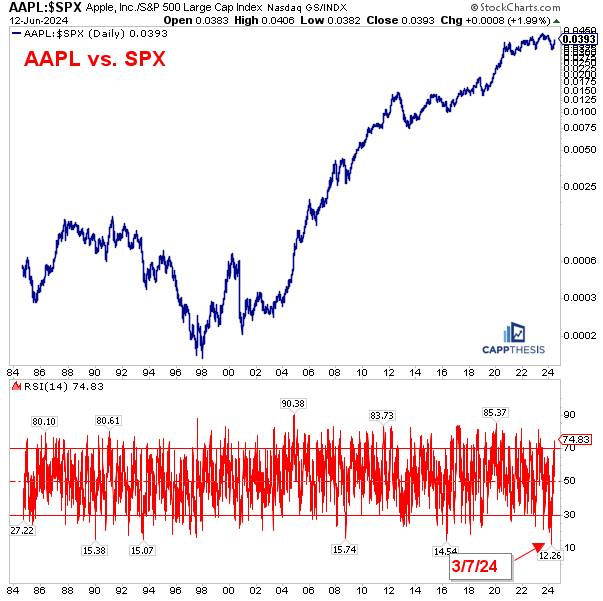
Does anyone recall what happened on March 7, 2024? There wasn’t much news that day for the stock, but AAPL declined for the seventh straight session. That was a long losing streak, but it was just part of a very trying start of the year. For that reason, AAPL didn’t receive the type of attention it has been used to over the years… Instead, NVDA and anything AI-related were the focus. This remains the case… In fact, on March 7th, 2024, relative to the S&P 500, AAPL hit its most oversold state EVER. In particular, the 14-day RSI of the AAPL/SPX ratio (AAPL vs. the SPX) plummeted to 12. In hindsight, we know that was a great buying opportunity, but was it that much better than any point in its history?
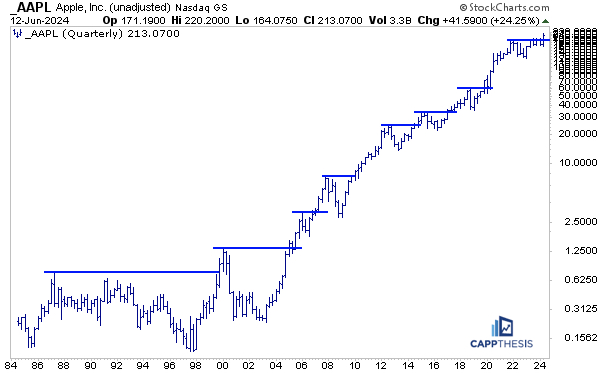
Let’s dig a little deeper. As this long-term chart shows, AAPL has followed the same pattern for decades: Break out to new highs, consolidate for long periods of time and break out again. From this perspective, the last two days simply created the latest multi-year breakout. Past performance is no guarantee of future success, but if AAPL follows the same path as it has for years, then this push to new highs won’t be the end of its strong run.
2/ Bitcoin
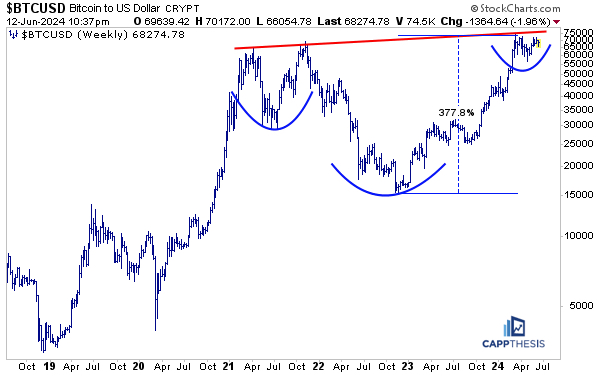
Bitcoin’s stall near 70,000 level so far in 2024 has frustrated traders who were expecting a major breakout this past March. But even Bitcoin can’t continue to spike with a 14-day RSI near 90, which is where the indicator shot up to at its most overbought state. However, by catching its breath over the last three months, BTC now has formed multiple bullish patterns.
Here are the first two: The green formation is a cup & handle pattern; the one in blue is an inverse Head & Shoulders pattern. The upside objectives would be 78,000 and 86,400, respectively. These are measured move targets, and they are attained simply by adding the height of each pattern to the breakout points. As of right now, BTC has not completely leveraged either of these. T. That makes the near-term price action critical, as additional weakness in the near-term could negate them both.

The much larger inverse cup & handle pattern has a bigger cushion. As is clear, the last three months of consolidation have constructed this potential right shoulder. We’d need a convincing breakout to new highs for this to become live. And that means we’d need to see the reviewed smaller formations continue to work first. What if the smaller patterns fail? Traders simply will have to wait for more to form.
3/ IWM Russell 2k ETF
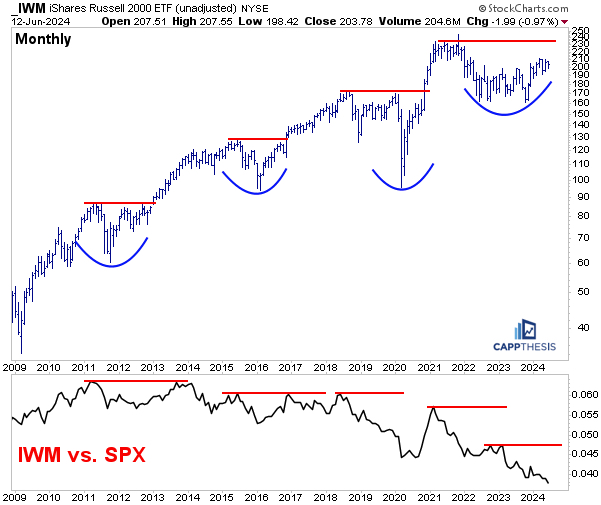
Needless to say, Small Caps continue to lag. It’s not that the IWM R2k ETF has been plummeting. In fact, it is +25% from the October’23 low, a little more than seven months ago. In in a vacuum, that would be considered a very healthy move in a relatively short span of time. But, investing often is a relative game. And with the SPX +32% and the NDX +38% over that same time frame – and many large cap tech names up a lot more – IWM still is playing catch-up.
We’ve seen this before. In fact, since the 2009 low, IWM has gone through three prior multi-year periods, all which included a big decline, an equally big comeback and then a breakout to new highs. All three breakouts led to strong moves for various months to come. From that point of view, the current comeback attempt looks a lot like those past iterations. It’s just taking longer this time. If/when IWM does finally return to its 2021 highs then, it very well could break out and see a similar extension. But should we actually care? As the lower panel of this chart depicts, during the snapback phases since 2009, IWM did, in fact outperform the SPX. But that relative strength faded just as IWM broke out from an absolute basis. If this behavior is replicated again soon, then buying the IWM up to the 240 level makes sense, however, sticking with it after that may not – at least relative to the S&P 500.
About This Week’s Author
Frank Cappelleri, CMT, CFA has been an active member of the CMT Association for over 20 years and received his CMT Charter in 2004. Frank had various roles during his 25-year Wall Street career, including equity sales trader, technical analyst, research sales specialist and desk strategist.
————
Originally posted on June 13th, 2024
Disclosure: Investopedia
Investopedia.com: The comments, opinions and analyses expressed herein are for informational purposes only and should not be considered individual investment advice or recommendations to invest in any security or to adopt any investment strategy. While we believe the information provided herein is reliable, we do not warrant its accuracy or completeness. The views and strategies described on our content may not be suitable for all investors. Because market and economic conditions are subject to rapid change, all comments, opinions and analyses contained within our content are rendered as of the date of the posting and may change without notice. The material is not intended as a complete analysis of every material fact regarding any country, region, market, industry, investment or strategy. This information is intended for US residents only.
Disclosure: Interactive Brokers
Information posted on IBKR Campus that is provided by third-parties does NOT constitute a recommendation that you should contract for the services of that third party. Third-party participants who contribute to IBKR Campus are independent of Interactive Brokers and Interactive Brokers does not make any representations or warranties concerning the services offered, their past or future performance, or the accuracy of the information provided by the third party. Past performance is no guarantee of future results.
This material is from Investopedia and is being posted with its permission. The views expressed in this material are solely those of the author and/or Investopedia and Interactive Brokers is not endorsing or recommending any investment or trading discussed in the material. This material is not and should not be construed as an offer to buy or sell any security. It should not be construed as research or investment advice or a recommendation to buy, sell or hold any security or commodity. This material does not and is not intended to take into account the particular financial conditions, investment objectives or requirements of individual customers. Before acting on this material, you should consider whether it is suitable for your particular circumstances and, as necessary, seek professional advice.
Disclosure: ETFs
Any discussion or mention of an ETF is not to be construed as recommendation, promotion or solicitation. All investors should review and consider associated investment risks, charges and expenses of the investment company or fund prior to investing. Before acting on this material, you should consider whether it is suitable for your particular circumstances and, as necessary, seek professional advice.
Disclosure: Cryptocurrency based Exchange Traded Products (ETPs)
Cryptocurrency based Exchange Traded Products (ETPs) are high risk and speculative. Cryptocurrency ETPs are not suitable for all investors. You may lose your entire investment. For more information please view the RISK DISCLOSURE REGARDING COMPLEX OR LEVERAGED EXCHANGE TRADED PRODUCTS.
Disclosure: Forex
There is a substantial risk of loss in foreign exchange trading. The settlement date of foreign exchange trades can vary due to time zone differences and bank holidays. When trading across foreign exchange markets, this may necessitate borrowing funds to settle foreign exchange trades. The interest rate on borrowed funds must be considered when computing the cost of trades across multiple markets.


Join The Conversation
If you have a general question, it may already be covered in our FAQs. If you have an account-specific question or concern, please reach out to Client Services.