


1/ The Russell 2000 Is Low Key Bullish Right Now
2/ Not the SPY Diving Off a Cliff
3/ We’ll Get There When We Get There
Investopedia is partnering with CMT Association on this newsletter. The contents of this newsletter are for informational and educational purposes only, however, and do not constitute investing advice. The guest authors, which may sell research to investors, and may trade or hold positions in securities mentioned herein do not represent the views of CMT Association or Investopedia. Please consult a financial advisor for investment recommendations and services.
1/
The Russell 2000 Is Low Key Bullish Right Now
If it weren’t for the Russell 2000 Index (RUT), investors might have a lot to worry about this week or even throughout the upcoming quarter. At least that’s what the charts seem to be whispering right now.
Consider the following chart of iShares’ Russell 2000 index ETF (IWM). No matter how close you look, you might not realize why this chart is so significant.
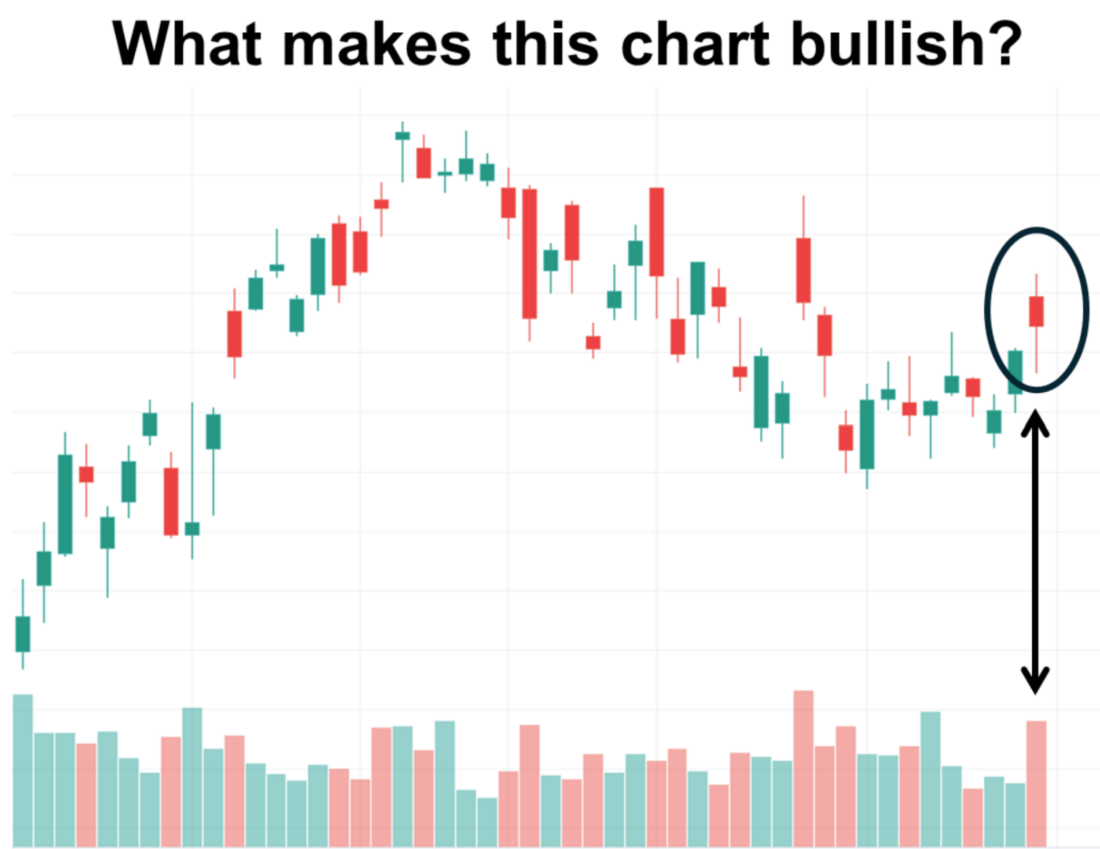
The big impact of this chart pattern comes from the realization of what is going on away from the chart completely: the annual Russell 2000 reconstitution. Each year on the last Friday of June, all Russell indexes are rebalanced, and some stocks are taken out of the mix with new ones added to replace them.
The details of what the changes will be are published during the month leading up to the rebalancing date, but even this information is subject to change right up until the close of that day. After the market closed last Friday (June 28) the changes were put into effect. Today marks the first day with the new batch of 2000 small-cap stocks.
Given the fact that there is at least a small amount of uncertainty behind this process, one might expect market participants to shy away from the index this time of year. Perhaps even so much that large funds would want to reduce their exposure to ETFs which track this index.
Which brings us to why the previously featured chart is actually telling a bullish story. Even though traders sold off during the Friday session, investors bought into the index creating a bullish gap in the price to open the day. This gap held through the close. How the market closes Monday will reveal a certain level of confirmation.
If IWM closes higher today than it did on Friday, investors have shown they are willing to accept exposure to the small-cap index. This is a bullish behaviour that assumes now is a good time to take risk.
2/
Not the SPY Diving Off a Cliff
The bullish close on Friday in IWM is doubly important as a market indication when compared with the potentially alarming price pattern on the S&P 500 right now. A chart of State Street’s S&P 500 Index ETF (SPY) is showing at least three textbook signals to indicate the possibility of a coming downward trend in prices. If these clear signals were a movie soundtrack, they’d be the dramatic crescendo just before Ethan Hunt rides his motorcycle off the alpine cliff.

The first signal is the bearish divergence visible when comparing SPY to the Cboe Volatility Index (VIX). This signal indicates that option sellers (professionals who know more than the average trader) see significant risk ahead and are charging higher prices to compensate for it.
The second signal is the fact that SPY was unable to make a new high compared to its recent all-time high. Instead, it found resistance at a lower price level on Friday.
The third is the bearish engulfing candle developed on Friday’s close. This two-candle pattern appears as the combination of a small-range day on the first candle and a large range day on the second. The price pattern in the chart shows that the first day closed higher than it opened completing a small gain along the way.
However, the second day opened higher and closed lower than all prices on the first day. Traders have considered this pattern a harbinger of lower prices for hundreds of years. However, it really isn’t as reliable as it sounds. Especially when something happens to cause the second day’s stretched out prices. Something like the end of a quarterly period, for example.
Fund managers and commercial traders often have business-related needs that drive the sale of shares on or before the quarter’s end. While sometimes the price movement can tip the hand of these institutional types, as often as not it may mean nothing.
The key will be to observe the price action today. If Monday closes with a strong downward move, it likely signals more falling prices to come. However, it is a reasonable bet that investors won’t panic today. If the previous story wasn’t reason enough to help you figure out why, consider that this holiday week is usually bullish on the three days leading up to the Fourth of July holiday.
3/
We’ll Get There When We Get There
Market participants appear to be riding the market indexes higher, perhaps as a way of keeping up with the lingering effects of multi-year inflation. With the Fed holding rates higher, conditions remain that are likely to maintain an inverted yield curve longer.
This refers to the idea that short-term borrowing rates are higher than longer-term ones. This is easily tracked by subtracting yield on the 2-year U.S. Treasury Note from the yield on the 10-year note (see chart below).

This weekly chart depicts yield curve inversions going back to 1989. All three previous inversions have preceded significant recessionary periods. The current inversion has been much deeper and more prolonged than the other three, and many analysts have expressed concern that this may be a signal of unavoidably difficult times ahead.
However, none of the recessions really kick in until the inversion returns above the zero line (red line on chart). For now, we aren’t there yet. But once the curve returns to normal, the possibility for a significantly bearish period in stocks might begin. At least for now, it appears that today is not that day.
—-
Originally posted 1st July 2024
Join The Conversation
If you have a general question, it may already be covered in our FAQs. If you have an account-specific question or concern, please reach out to Client Services.
Leave a Reply
Disclosure: Investopedia
Investopedia.com: The comments, opinions and analyses expressed herein are for informational purposes only and should not be considered individual investment advice or recommendations to invest in any security or to adopt any investment strategy. While we believe the information provided herein is reliable, we do not warrant its accuracy or completeness. The views and strategies described on our content may not be suitable for all investors. Because market and economic conditions are subject to rapid change, all comments, opinions and analyses contained within our content are rendered as of the date of the posting and may change without notice. The material is not intended as a complete analysis of every material fact regarding any country, region, market, industry, investment or strategy. This information is intended for US residents only.
Disclosure: Interactive Brokers
Information posted on IBKR Campus that is provided by third-parties does NOT constitute a recommendation that you should contract for the services of that third party. Third-party participants who contribute to IBKR Campus are independent of Interactive Brokers and Interactive Brokers does not make any representations or warranties concerning the services offered, their past or future performance, or the accuracy of the information provided by the third party. Past performance is no guarantee of future results.
This material is from Investopedia and is being posted with its permission. The views expressed in this material are solely those of the author and/or Investopedia and Interactive Brokers is not endorsing or recommending any investment or trading discussed in the material. This material is not and should not be construed as an offer to buy or sell any security. It should not be construed as research or investment advice or a recommendation to buy, sell or hold any security or commodity. This material does not and is not intended to take into account the particular financial conditions, investment objectives or requirements of individual customers. Before acting on this material, you should consider whether it is suitable for your particular circumstances and, as necessary, seek professional advice.
Disclosure: ETFs
Any discussion or mention of an ETF is not to be construed as recommendation, promotion or solicitation. All investors should review and consider associated investment risks, charges and expenses of the investment company or fund prior to investing. Before acting on this material, you should consider whether it is suitable for your particular circumstances and, as necessary, seek professional advice.
Disclosure: Futures Trading
Futures are not suitable for all investors. The amount you may lose may be greater than your initial investment. Before trading futures, please read the CFTC Risk Disclosure. A copy and additional information are available at ibkr.com.


Does this mean the 2-year note is paying a higher rate than the 10-year note? If so, exactly why is it a bearish signal for the markets?