


The tumultuous electric vehicle sector plays host to a field of upstarts who have featured prominently in the securities lending market for several years. In 2023, EV manufacturers Lucid Group (LCID), Fisker Inc. (FSKR) and Nikola Corporation (NKLA) as well as lithium battery producer Upstart Holdings (UPST) all ranked within the global top-10 revenue generating securities in the lending market.
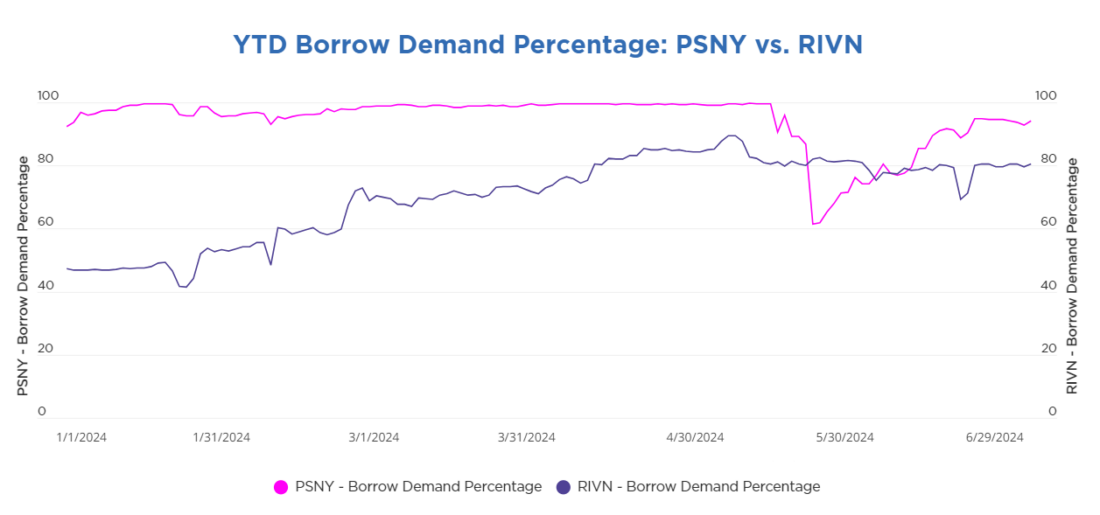
The first half of 2024 has seen continued volatility with several manufacturers jockeying for position and some for a lifeline. Polestar (PSNY), a Swedish manufacturer owned by Volvo (VOLV), announced in February that it had secured nearly USD $1 Billion in external funding through a three-year loan facility to solidify the company’s financials. The NASDAQ listed firm has seen a roughly 65% decline in its stock price year-to-date. In the lending market, shares of Polestar are highly in demand with an average borrow demand1 percentage of 94% and short-interest indicator2 of 11% in 2024.
Like Polestar, Rivian Automotive (RIVN) sought a strategic partnership to raise capital and expand its global footprint. However, the fast-growing manufacturer landed an even bigger fish when it announced a USD $5 billion dollar deal with Volkswagen (VWAGY ADR). The agreement will include the creation of a new joint venture focused on EV operating system software development, a move that will help buttress both VW’s electric car business and Rivian’s balance sheet.
In the lending market, investor sentiment is relatively positive for Rivian. In Q2, the average buyside financing rate for the startup was just 80.33 basis points, just a fraction of Polestar’s 18,180.32 bps over the same period.
Perhaps most definitively, Fisker Inc. filed for bankruptcy in June with the intention to liquidate its assets and wind down operations. The announcement was the death knell for a company that toiled in the space for seven years but struggled to manufacture a consumer-level product.
Fisker held talks with major automakers in the early part of the year in an attempt to secure a production partnership, a move that coincided with borrow quantities rising from 77 million shares on January 1 to over 155 million shares by March 26. The negotiations concluded without an agreement and NYSE moved to delist the stock.

Despite its peers struggling to get off the ground, Tesla Motors (TSLA) has become the most valuable auto manufacturer globally, soaring to the upper echelon of mega-cap firms. With its commercial success, it’s not surprising that the securities lending market, primarily driven by short selling, has been all quiet on the Tesla front as of late (TSLA had featured prominently in the past and was the top earning security in 2018).
Tesla’s average borrow demand percentage has been just 3.1% since the start of 2022. Compare that figure to Lucid Motors (LCID), one of Tesla’s competitors in the luxury EV space, which on average was 97% in-demand over the same period. Similarly, when looking at financing costs, Tesla is an easy-to-borrow name with continuous GC rates since 2020.
2024 has so far been a roller coaster ride for Tesla investors, and one with more valleys than peaks. With slowing growth in EV sales and fierce international competition, Tesla reported a 9% drop in Q1 revenue, the worst such decline for the firm in over a decade. At its lowest, Tesla stock was down over 40% YTD as CEO Elon Musk cut jobs and sales forecasts.
Despite the increasing headwinds, the needle has barely moved for Tesla in the securities finance market, an indication that short investors don’t see much of an opportunity betting against the auto giant. The following chart shows a one-year history for Tesla’s borrow quantity and borrow demand percentage. While there have been some fluctuations, the quantities shown are a tiny blip relative to Tesla’s float and the overall trend-line is nearly flat.

—
Originally Posted July 12, 2024 – THE EV SECTOR REMAINS HOT IN THE SECURITIES LENDING MARKET
1 The ratio of borrowed shares to the total quantity available in securities lending programs
2 The ratio of borrowed shares to the public float of the security
Bloomberg Terminal users can subscribe to EquiLend’s exclusive Orbisa securities lending data by entering terminal shortcut APPS ORBISA <GO> or clicking the following link: https://blinks.bloomberg.com/screens/apps%20orbisa.
Disclosure: Orbisa
ORBISA (the “Firm”) is not registered as an investment advisor or otherwise in any capacity with any securities regulatory authority. The information contained, referenced or linked to herein is proprietary and exclusive to the Firm, does not constitute investment or trading advice, is provided for general information and discussion purposes only and may not be copied or redistributed without the Firm’s prior written consent. The Firm assumes no responsibility or liability for the unauthorized use of any information contained, referenced or linked to herein. © 2023 EquiLend Holdings LLC. All rights reserved.
Disclosure: Interactive Brokers
Information posted on IBKR Campus that is provided by third-parties does NOT constitute a recommendation that you should contract for the services of that third party. Third-party participants who contribute to IBKR Campus are independent of Interactive Brokers and Interactive Brokers does not make any representations or warranties concerning the services offered, their past or future performance, or the accuracy of the information provided by the third party. Past performance is no guarantee of future results.
This material is from Orbisa and is being posted with its permission. The views expressed in this material are solely those of the author and/or Orbisa and Interactive Brokers is not endorsing or recommending any investment or trading discussed in the material. This material is not and should not be construed as an offer to buy or sell any security. It should not be construed as research or investment advice or a recommendation to buy, sell or hold any security or commodity. This material does not and is not intended to take into account the particular financial conditions, investment objectives or requirements of individual customers. Before acting on this material, you should consider whether it is suitable for your particular circumstances and, as necessary, seek professional advice.


Join The Conversation
If you have a general question, it may already be covered in our FAQs. If you have an account-specific question or concern, please reach out to Client Services.