


A key part of Mill Street’s work is tracking US and global equity sector and industry trends using a mix of bottom-up (aggregated company data) and top-down (macro data) inputs. The Technology sector naturally gets a lot of attention from investors, and we have shifted our view on it recently in response to changes in our indicators. So let’s take a closer look at what our indicators tell us about the Technology sector.
First: what is “Tech”?
The first question that arises when analyzing sectors and industries is how to define them, as there is not a single, universally-agreed way to categorize companies into a sector/industry hierarchy. The most widely-used hierarchy in investment management is the Global Industry Classification System (GICS), run jointly by Standard & Poor’s (S&P) and MSCI and used in their benchmark indices. That is the one we use at Mill Street, but there are others, like those used by Bloomberg, Russell/FTSE (ICB/EICB), Reuters, and Factset. There are also government-produced classifications (which may include non-public companies too) like Standard Industrial Classification (SIC) codes used in SEC filings and government data, and the North American Industry Classification System (NAICS).
Since all of these industry classification systems are different, they may not categorize any particular company the same way. In the case of the Technology sector, we often hear from clients that they view “Tech” differently than GICS does. So a Tech analyst at a bank or investment management firm might cover popular “big Tech” companies like Apple, Microsoft, NVIDIA, Alphabet (Google), Meta, Netflix, and Amazon, and perhaps even Tesla. But according to GICS, the last five of those stocks are not considered part of the Technology sector (only Apple, Microsoft, and NVIDIA are in the GICS Technology sector). Alphabet, Meta, and Netflix are in the Communications Services sector, while Amazon is in Consumer Discretionary (despite being the world’s biggest cloud computing provider, more of its revenues come from retail) as is Tesla (as an auto-maker).
So in our analysis here, we will mostly talk about the GICS Technology sector, while keeping in mind that some other “Tech-related” companies are often viewed as Tech by investors.
Weights matter
In addition to the classification scheme used, the other key thing to keep in mind is the influence of weighting schemes when viewing aggregated data. Much of what is published and talked about in terms of sector performance and fundamentals uses cap-weighted (or dollar-weighted) data, so the biggest companies (with the largest market caps or largest earnings) have the most weight in the aggregate.
For instance, the S&P 500 Technology sector has 65 constituents right now. If each stock had equal weight, then each stock would have a weight of about 1.5%. But the index is cap-weighted, so as of the latest quarterly rebalancing, the two dominant mega-caps of Microsoft and Apple each hold about 22% of the weight, or 44% combined. Including the next two largest companies, NVIDIA and Broadcom, gives the top four companies about 54% of the total weight (i.e., more than all the other 61 combined). Note that index weights are updated by S&P on a quarterly basis and NVIDIA’s weight will very likely rise substantially at the next rebalancing later in June after its huge recent gains.
Just for reference, in our database the 10 largest stocks in the Technology sector by market cap right now are:
| Name | Market Cap ($Bil) |
| Microsoft Corporation | 3,151 |
| NVIDIA Corporation | 3,012 |
| Apple Inc. | 3,003 |
| Taiwan Semiconductor Manufacturing Co | 684 |
| Broadcom Inc. | 655 |
| ASML Holding NV | 410 |
| Samsung Electronics Co., Ltd. | 374 |
| Oracle Corporation | 337 |
| Advanced Micro Devices, Inc. | 269 |
| QUALCOMM Incorporated | 236 |
So the question arises: does the performance and/or fundamentals of the cap-weighted Technology sector really reflect the entire sector, or just the specific results of a handful of companies which may or may not reflect what the many other companies in the sector are doing?
The natural way to address this is to look at both cap-weighted and equal-weighted data for returns and fundamentals (earnings, etc.). However, not many data providers actually provide equal-weighted data since it is less often used as a benchmark for investment managers. This is one way Mill Street can offer something clients may not readily find elsewhere: we have equal-weighted data for a broad array of US and global sector/industry aggregates as well as regional, style, and other aggregates.
Importantly, though, we only include stocks that have enough size, liquidity, and analyst coverage to be relevant for institutional investors. So very small or micro-caps (US stocks below $200 million, and non-US stocks below $500 million market cap) and those with little or no analyst coverage are not included in our database. This means we avoid a potential skew toward very small companies that often plagues academic research, which often does not restrict the company universe to exclude the large number of small public companies and can thus dominate an equal-weighted measure.
Armed with both cap-weighted and equal-weighted data (on the same broad but institutionally-investable universe), we can see if the trends are the result of a few mega-caps or indicative of the overall sector.
Global Technology is less strong than you might think, and has weakened
While much of the attention in the Technology sector naturally focuses on the handful of big US Tech companies, the sector does in fact have quite a few constituents globally. Within our broad 6500-stock global universe, there are currently 819 stocks that fall within the GICS Technology sector, of which 338 are US listings (including ADRs). Those are the universes we will focus on here.
Those who know Mill Street’s work will know that we focus a lot of attention on indicators based on the direction and magnitude of analysts’ revisions to their forward (next 12 month) earnings estimates. Such indicators have been useful guides to the trend and momentum of the fundamentals for individual companies as well as aggregates like sectors, regions, etc. Because estimate revisions often move up and down together based on the overall economic environment, we compare revisions for sector or industry aggregates with the revisions for the broader global or US universe of stocks as a benchmark. We do the same for our relative return analysis.
Starting with the broad global Technology sector, the first thing we look at is relative revisions on our equal-weighted and cap-weighted aggregates, and then see how relative returns are behaving and check on relative valuations.
The two charts below show the global Technology sector’s indicators for relative returns (black line and green line), relative fundamentals (earnings estimate revisions, red line/blue bars) and relative valuations (purple line). The left chart shows the data on an equal-weighted (EW) basis while the right chart shows it on a cap-weighted (CW) basis.
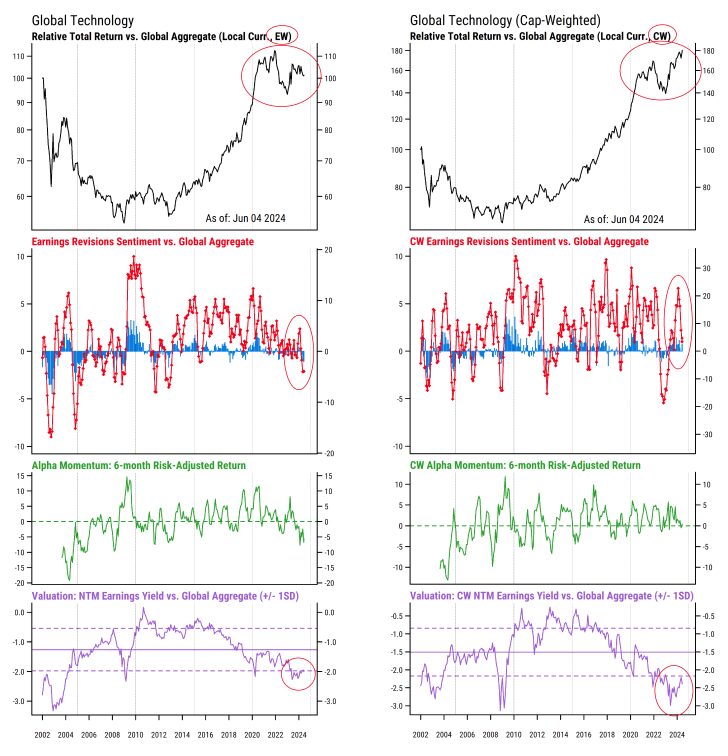
Source: Mill Street Research, Factset
We focus first on revisions breadth (red line) and revisions magnitude (blue bars) in the second section.
We can see that the Tech sector’s equal-weighted revisions breadth has spent most of the last decade above the global average (above zero on the chart), i.e., analysts have raised EPS estimates more often for Tech companies than for all companies on average. But the latest readings show a notable dip into negative territory (Tech revisions below the global average). This is the first time we have seen meaningfully negative readings like this since 2013.
The right chart showing the cap-weighted data looks a bit different but also shows a notable decline in relative revisions for Tech. Even more than the equal-weighted data, the cap-weighted revisions have spent the great majority of the last 20 years above the global (cap-weighted) average. So below-average readings have been rare for this growth-oriented sector and the current readings that are now only slightly above average actually look to be near the middle or even lower end of the sector’s normal range.
So is Tech doing badly on fundamentals? Not really, particularly since earnings globally are still growing and revisions for the average stock are at or above the historical average. But Tech’s relative fundamental trends are certainly weaker than they looked just a few months ago compared to other stocks. This may be partly some actual weakness in Tech and partly improvement in non-Tech sectors lately. Something has shifted and the sector’s fundamental tailwinds do not look as strong now.
Relative returns
The most notable divergence between the left (equal-weighted) and right (cap-weighted) charts are in the relative return series (black lines at the top). Relative returns for global Technology stocks actually peaked on an equal-weighted basis back in late 2021, then lagged substantially in 2022, and outperformed in 2023 before showing mixed to negative relative returns in 2024. The recent pullback in relative performance in the equal-weighted returns looks consistent with the pullback in relative earnings estimate revisions (second section of left chart), and our six-month risk-adjusted price momentum indicator (we call Alpha Momentum, the green line) remains negative. This means global Tech stocks have underperformed the returns that would be expected based on market activity given Tech’s market beta, style (growth-biased) and size tilts. The key point is that simply throwing darts at the global Tech sector to pick stocks lately would not have produced outperformance, despite what some of the major Tech-oriented indices would show.
But when viewed on a cap-weighted basis (dominated by US mega-cap Tech), relative returns have been making new highs and are well above the 2021 peak. This makes it clear that the largest stocks in the sector have outperformed the average stock in the sector both over the longer-term and in the last 18 months. While the earnings for the largest stocks have also outpaced those of the smaller constituents of the sector, the slowdown in relative revisions activity has not (so far) been associated with weaker cap-weighted relative returns in the same way it has for the equal-weighted returns.
Relative valuations
The purple lines in each chart show our measure of relative valuations for the Tech sector vs the global average. For the equal-weighted data (left), we find the median forward earnings yield (consensus expected EPS / price) among Tech stocks and subtract the median forward earnings yield for all stocks globally. Using earnings yields instead of price/earnings ratios allows small or negative earnings to be accounted for correctly in the calculation, and means that higher values are better (i.e., cheaper). For the cap-weighted data (right) we calculate the cap-weighted forward earnings yield (each stock’s earnings yield multiplied by its relative weight in overall Tech universe) and subtract the cap-weighted global earnings yield.
In both equal- and cap-weighted data, we see low relative earnings yields compared to history, and also compared to the overall global market. The mostly negative numbers plotted indicate that Tech earnings yields are lower than the global average, meaning Tech stocks are normally more expensive (the solid line is the long-run average, and dashed lines are +/- 1 standard deviation from average), as one might expect. Currently, Tech stocks are more expensive than usual compared to the average global stock, which is not surprising given the extent of the decade-long outperformance trend seen in the top sections of the chart.
So while valuations are rarely good for precise timing of sector allocations, we can see that valuations (and thus expectations) are relatively high in the Tech sector now, which raises the potential risk IF earnings growth slows, or comes in below expectations. The recent slowdown in relative estimate revisions makes that scenario somewhat more likely, but certainly does not guarantee anything. The history shown in the charts clearly indicates that there have been slowdowns in relative revisions before that had only modest impacts on relative returns, though rarely with valuations where they are now.
US Tech
We see many of the same trends when we focus specifically on the US Technology sector (which makes up a significant proportion of the global Tech sector). The charts below are identical to the global versions above but only include US listed stocks.
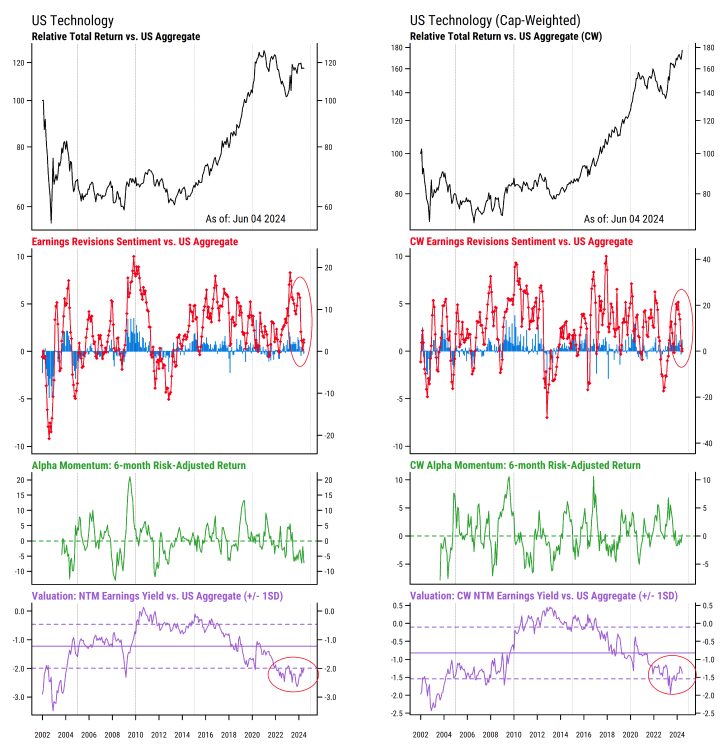
Source: Mill Street Research, Factset
Earnings trends have been better in Technology than the average US stock for most of the last decade, so the drop-off in relative revisions in the last few months looks notable in that context. And the cap-weighted data is perhaps more interesting, given that it is the largest-cap stocks that have had the most attention and are often assumed to be doing the best given their aggregate stock price performance. The fact that cap-weighted Tech sector revisions in the US are now only about in line with the overall US cap-weighted average might come as a surprise, and is clearly a change from just two months ago.
The relative valuation picture in US Technology is similar to the global picture: on the expensive end of the 20+ year historical range, though the cap-weighted data show relative valuations somewhat less extreme and holding in the range seen in the mid-2000s. The equal-weighted (median) relative valuations have improved somewhat following the recent mixed relative returns, but are still on the expensive side of history.
A shift from overweight to neutral
Last month, we alerted clients to the shifts we noted in the Technology sector indicators and recommended scaling back relative positioning in Tech somewhat. From February 2023 to last month, we had been overweight Tech (i.e., recommending holding more than the benchmark weight in Technology) and that stance worked out well, particularly on a cap-weighted basis that many of our institutional clients focus on. Now we see the sector losing some fundamental momentum at the same time that valuations are on the expensive side of history. This does not argue for avoiding Tech entirely or even underweighting it in our view, hence our neutral/benchmark stance.
Tech stocks should continue to have some of the best long-term secular growth prospects of all the sectors, particularly in the US. But with other sectors like Financials and Industrials showing better relative strength in some ways, there could be opportunities elsewhere that are worth pursuing that require scaling back in Tech to take advantage of.
We do not view Technology stocks in general as being in any sort of “bubble” like the one experienced in the late 1990s, and certainly remind clients frequently that the “Tech” sector is quite broad and diverse and thus will always have some areas that are strong and some that are weaker at any point in time. Having objective indicators to keep our focus on the relevant data and not get distracted by headlines or “married” to a position has long been one of the key elements of Mill Street’s work, and hopefully this example is helpful for those building their own investment process or seeking to improve their current one.
—
Originally Posted June 6, 2024 – A CLOSER LOOK AT THE GLOBAL TECH SECTOR
Disclosure: Mill Street Research
Source for data and statistics: Mill Street Research, FactSet, Bloomberg
This report is not intended to provide investment advice. This report does not constitute an offer or solicitation to buy or sell any securities discussed herein in any jurisdiction where such offer or solicitation would be prohibited. Past performance is not a guarantee of future results, and no representation or warranty, express or implied, is made regarding future performance of any security mentioned in this report.
All information, opinions and statistical data contained in this report were obtained or derived from public sources believed to be reliable, but Mill Street does not represent that any such information, opinion or statistical data is accurate or complete. All estimates, opinions and recommendations expressed herein constitute judgments as of the date of this report and are subject to change without notice.
Disclosure: Interactive Brokers
Information posted on IBKR Campus that is provided by third-parties does NOT constitute a recommendation that you should contract for the services of that third party. Third-party participants who contribute to IBKR Campus are independent of Interactive Brokers and Interactive Brokers does not make any representations or warranties concerning the services offered, their past or future performance, or the accuracy of the information provided by the third party. Past performance is no guarantee of future results.
This material is from Mill Street Research and is being posted with its permission. The views expressed in this material are solely those of the author and/or Mill Street Research and Interactive Brokers is not endorsing or recommending any investment or trading discussed in the material. This material is not and should not be construed as an offer to buy or sell any security. It should not be construed as research or investment advice or a recommendation to buy, sell or hold any security or commodity. This material does not and is not intended to take into account the particular financial conditions, investment objectives or requirements of individual customers. Before acting on this material, you should consider whether it is suitable for your particular circumstances and, as necessary, seek professional advice.

Join The Conversation
If you have a general question, it may already be covered in our FAQs. If you have an account-specific question or concern, please reach out to Client Services.