

")


Anatomy of a Market Top: Lessons from Domino’s Pizza
Investopedia is partnering with CMT Association on this newsletter. The contents of this newsletter are for informational and educational purposes only, however, and do not constitute investing advice. The guest authors, which may sell research to investors, and may trade or hold positions in securities mentioned herein do not represent the views of CMT Association or Investopedia. Please consult a financial advisor for investment recommendations and services.
Anatomy of a Market Top: Lessons from Domino’s Pizza
Let’s dive into an intriguing case study to kick things off—Domino’s Pizza Group (DPZ). It’s a stock that’s recently made headlines for all the wrong reasons, gapping lower this past week and serving as a textbook example of a distribution phase. But why is this case so enlightening, and what can it tell us about the broader market trends, particularly the S&P 500? Stick with me, and we’ll break it down.
WHAT IS A MARKET TOP, ANYWAY?
Before we jump into the specifics of Domino’s, let’s make sure we’re all on the same page about a market top. Essentially, a market top is where a stock transitions from an upward trend (accumulation phase) to a downward trend (distribution phase). This is more than just a temporary dip; it’s a significant shift signifying that the buying power is dwindling and selling pressure is taking over.
Check out our recent discussion on what should be included in your Market Top Checklist!
WHY DOMINO’S PIZZA?
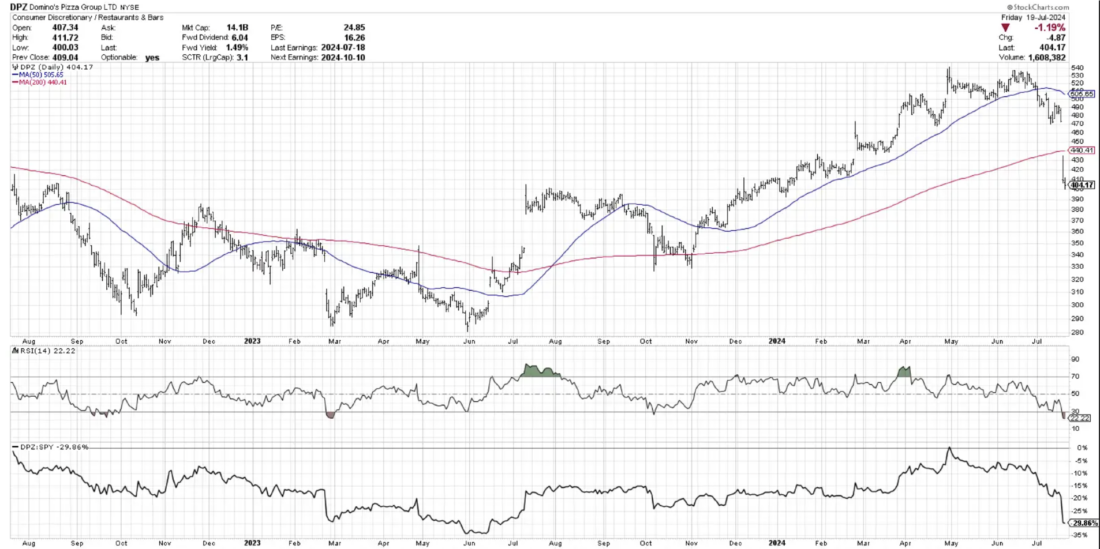
So, why focus on DPZ? Domino’s hit a peak in April this year, driven initially by what can be described as an “exhaustion gap.” After a remarkable run, the stock surged up one final time, much like a marathon runner gasping for that final breath at the finish line. Unfortunately, while we retested those April highs in June, we never actually moved higher. In fact, things started to fall apart in late June and early July. Domino’s ended up gapping lower this week, plummeting below its 200-day moving average, and dropping around 13.5% on Thursday alone.
Now, was this surprising? Not if you’ve been paying attention. The signs were all there. Let’s dissect the anatomy of this market top to uncover those telltale signals.
THE TRANSITION FROM ACCUMULATION TO DISTRIBUTION
First, recognize the phases. An accumulation phase is marked by higher highs and higher lows, showing that buying power is outstripping selling pressure. On the other hand, a distribution phase is characterized by lower lows and lower highs, indicating that selling pressure is taking over.
In the case of DPZ, the accumulation phase was visible all the way through the start of this year. Higher highs, higher lows, prices comfortably above upward sloping moving averages, and strong momentum—all checked out.
Around late April, however, a different picture began emerging. We saw the first red flag: Domino’s failed to make a new high. Then came the next crucial indicator—the breakdown below the previous swing low. By early July, it was evident that the pattern had shifted. The stock dipped below its 50-day moving average, which started to slope downwards. These were clear signals that the accumulation phase was over, making room for the distribution phase.
When looking at the current top, we should consider the Ten Questions ESign In – Market Misbehaviorvery Investor Should Ask before changing strategy!
MOMENTUM MAKES ITS MOVE
Another critical factor to examine is the momentum. During the accumulation phase, the RSI (Relative Strength Index) for DPZ showed consistent strength, rarely dipping below 40. But in early July, we saw the RSI fall under 40, confirming the change in momentum. Essentially, when the RSI drops from above 50 to below 50, it tells us that down days are starting to outstrip up days. And in a distribution phase, that’s a sign of investors starting to sell off.
CONNECTING THE DOTS: THE S&P 500
So, why should this DPZ lesson matter to you? Because it could offer a preview of what might happen to the S&P 500. Right now, the S&P 500 hasn’t yet shown the exhaustion gap or the significant breakdowns that DPZ has, but certain conditions appear worryingly similar. We’re potentially at the end of an upward phase. To keep an eye on broader market indices like the S&P or QQQ, ask yourself: Is the index failing to make new highs? Is it breaking below recent swing lows? Has the 50-day moving average started to trend downward? Is the RSI weakening?
THE BOTTOM LINE
Understand these indicators, and you’ll put yourself in a much better position to navigate market tops, whether you’re looking at individual stocks like DPZ or broader indices like the S&P 500. The clues are there—start watching for them.
—–
Originally posted 23rd July 2024
Disclosure: Investopedia
Investopedia.com: The comments, opinions and analyses expressed herein are for informational purposes only and should not be considered individual investment advice or recommendations to invest in any security or to adopt any investment strategy. While we believe the information provided herein is reliable, we do not warrant its accuracy or completeness. The views and strategies described on our content may not be suitable for all investors. Because market and economic conditions are subject to rapid change, all comments, opinions and analyses contained within our content are rendered as of the date of the posting and may change without notice. The material is not intended as a complete analysis of every material fact regarding any country, region, market, industry, investment or strategy. This information is intended for US residents only.
Disclosure: Interactive Brokers
Information posted on IBKR Campus that is provided by third-parties does NOT constitute a recommendation that you should contract for the services of that third party. Third-party participants who contribute to IBKR Campus are independent of Interactive Brokers and Interactive Brokers does not make any representations or warranties concerning the services offered, their past or future performance, or the accuracy of the information provided by the third party. Past performance is no guarantee of future results.
This material is from Investopedia and is being posted with its permission. The views expressed in this material are solely those of the author and/or Investopedia and Interactive Brokers is not endorsing or recommending any investment or trading discussed in the material. This material is not and should not be construed as an offer to buy or sell any security. It should not be construed as research or investment advice or a recommendation to buy, sell or hold any security or commodity. This material does not and is not intended to take into account the particular financial conditions, investment objectives or requirements of individual customers. Before acting on this material, you should consider whether it is suitable for your particular circumstances and, as necessary, seek professional advice.
Disclosure: ETFs
Any discussion or mention of an ETF is not to be construed as recommendation, promotion or solicitation. All investors should review and consider associated investment risks, charges and expenses of the investment company or fund prior to investing. Before acting on this material, you should consider whether it is suitable for your particular circumstances and, as necessary, seek professional advice.

Join The Conversation
If you have a general question, it may already be covered in our FAQs. If you have an account-specific question or concern, please reach out to Client Services.