


We continue to believe we are nearing the end of the “mixed market environment,” and the beginning of a new, broad-based bull market advance. With that said, we are still waiting for confirmation in the form of breakouts for small-caps (IWM) and Industrials (XLI) in order to turn bullish. Additionally, we would like to see MSCI China (MCHI) break above $74 resistance; this would be a major boon for risk sentiment.
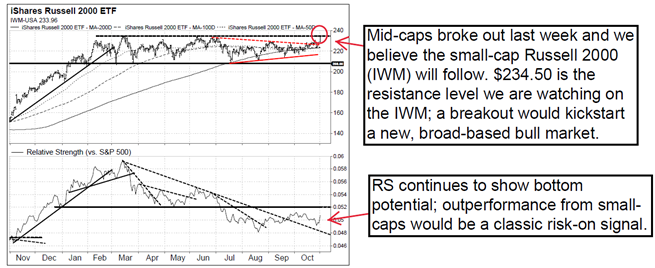
- Semiconductors & Transports Breaking Out. The PHLX Semiconductor index (SOXX) and the equal-weighted Transportation Sector (XTN) are the latest cyclical areas to break out to new YTD closing highs. They join the list that includes Energy (XOP), Financials/banks (XLF, KRE), mid-caps (IJH), and equal-weighted Discretionary (RCD). Virtually all signs are pointing to a new broad-based bull market. That leaves the Russell 2000 small-caps (IWM) and Industrials (XLI) as the last two key areas that we would like to see break out to YTD highs, and we believe it will happen soon. Lastly, we would like to see MSCI China (MCHI) break above the key $74 resistance level; as long as it remains below $74 it will be a drag on overall risk sentiment… see chart below.
- Cyclicals vs. Defensives, Gold vs. S&P 500. Cap- and equal-weighted Discretionary vs. Staples ratios (XLY/XLP, RCD/RHS) continue to hit new highs, as has been the case for over a month. Additionally, the gold vs. S&P 500 ratio is hitting 16+ year lows. These are major risk-on signals.
- 10-Year Treasury Yield. The 10-year Treasury yield is testing logical resistance in the 1.69-1.76% range; we believe the 10-year yield will need to get above this range in order for value to outperform. As long as support around 1.40-1.45% holds we expect an eventual breakout above 1.76%.
- S&P 500. The S&P 500 remains bullish as it hit our 4600 initial target. Resistance remains at the solid red uptrend (see chart on page 5), which is currently 4620. As long as the S&P 500 remains above supports at 4545, the 50-day MA (4463), and 4430, we expect to see 4700 next (the blue dashed uptrend).
Source:FactSet
Disclosure: Vermilion Research
The information contained herein is privileged, confidential and protected from disclosure. Any unauthorized disclosure distribution, dissemination or copying of this material or any attachment is strictly prohibited; such information, whether derived from Vermilion Vermilion Capital Management, LLC or from any oral or written communication by way of opinion, advice, or otherwise with a principal of the company is not warranted in any manner whatsoever, is for the use of our customers only and may be obtained from internal and external research sources considered to be reliable. It is not necessarily complete and its accuracy is not guaranteed by Vermilion Capital Management, LLC, its operating entity or the principals therein. Neither the information nor any opinion expressed constitutes a solicitation for the purchase of any future or security referred to in Vermilion research publications. Principals of Vermilion Capital Management, LLC may or may not hold, or be short of, securities discussed herein, or of any other securities, at any time. The foregoing also expressly applies to any trial subscription.
Disclosure: Interactive Brokers
Information posted on IBKR Campus that is provided by third-parties does NOT constitute a recommendation that you should contract for the services of that third party. Third-party participants who contribute to IBKR Campus are independent of Interactive Brokers and Interactive Brokers does not make any representations or warranties concerning the services offered, their past or future performance, or the accuracy of the information provided by the third party. Past performance is no guarantee of future results.
This material is from Vermilion Research and is being posted with its permission. The views expressed in this material are solely those of the author and/or Vermilion Research and Interactive Brokers is not endorsing or recommending any investment or trading discussed in the material. This material is not and should not be construed as an offer to buy or sell any security. It should not be construed as research or investment advice or a recommendation to buy, sell or hold any security or commodity. This material does not and is not intended to take into account the particular financial conditions, investment objectives or requirements of individual customers. Before acting on this material, you should consider whether it is suitable for your particular circumstances and, as necessary, seek professional advice.
Disclosure: Futures Trading
Futures are not suitable for all investors. The amount you may lose may be greater than your initial investment. Before trading futures, please read the CFTC Risk Disclosure. A copy and additional information are available at ibkr.com.
