1/ USD/JPY – What’s Going On?
2/ Short Interest – Did Someone Say Run Away?
3/ It’s a Rotation Game
4/ Everyone’s Favorite Stocks
Investopedia is partnering with CMT Association on this newsletter. The contents of this newsletter are for informational and educational purposes only, however, and do not constitute investing advice. The guest authors, which may sell research to investors, and may trade or hold positions in securities mentioned herein do not represent the views of CMT Association or Investopedia. Please consult a financial advisor for investment recommendations and services.
1/ USD/JPY – What’s Going On?
One of my favorite parts of technical analysis, and that which I probably try to impart the most to my students in class, or my readers in social media, is intermarket analysis. I have had the good fortune of working in most major asset classes – FX, fixed income, equities, options – in the three major time zones in the world – Asia, Europe and US. Thus, I have seen that traders across the world and across different products have different perspectives, time horizons and sources of information. Thus, we can learn a lot about our own asset class by looking at price action in others.

Source: StayVigilant.Substack.com, Bloomberg
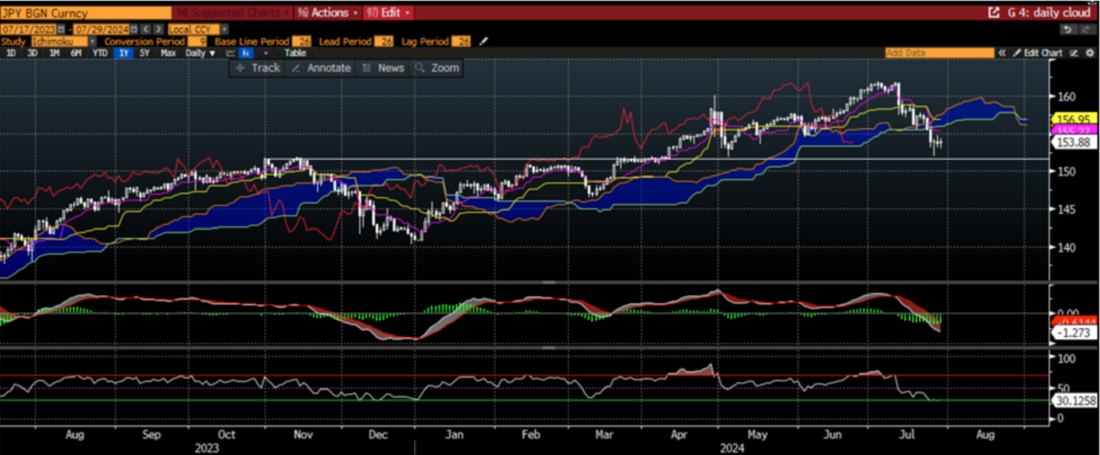
Take for instance the chart of USD/JPY. This currency pair is one of the anchor currency pairs that everyone should keep on their radar. For one, both currencies are reserve currencies and are thus held by major corporations, asset owners and central banks. For another, Japanese investors have the largest capital surplus in the world and search the world for better returns. Finally, because of the low interest rates and recent trend, leveraged investors like hedge funds and commodity trading advisors have been borrowing in Yen and investing those proceeds abroad.
The risk for these investors, of course, is a strengthening of the Yen. As you can see from this 1-year chart, that hasn’t been much of a risk. The white line I have drawn is the level where the Bank of Japan has intervened in the past. This year, the market moved right through there. Recently, however, the Yen has strengthened. Price has moved below the ichimoku cloud to a level just above previous intervention. The lagging span has moved into the cloud. Is the trend about to change? What ramifications would that have on other assets?
2/ Short Interest – Did Someone Say Run Away?
As I mentioned, borrowing in Yen at low interest rates, and effectively running a short Yen position as that currency is swapped into other currencies, has been an easy trade for leveraged investors. I say easy because the amount they need to pay back effectively goes lower and lower as the Yen weakens. However, we the currency strengthens, a leveraged investor has to decide if they want to keep their positions and find some way to raise cash to pay back Yen, or to close their positions.


Source: StayVigilant.Substack.com, Bloomberg
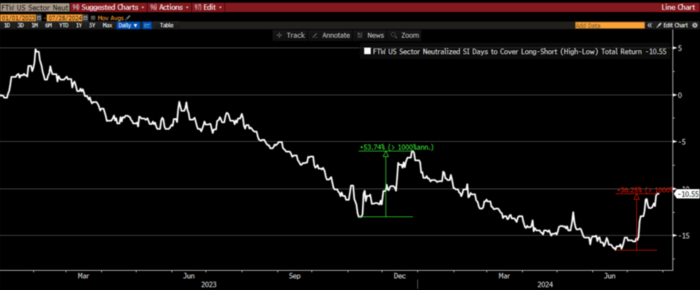
This is useful context when I look at the price action of the Bloomberg sector neutral short-interest factor. This factor looks at the performance of heavily shorted stocks vs. those that are not. It neutralizes the sector to see how it is responding without that effect, and because many HF are organized by sector.
We can see that this factor has spiked considerably in the last month. In fact it is up almost 40%, suggesting there was a great deal of short covering which happens to coincide with the recent strength in the Yen. We saw a similar move in this factor late last year in November/December. The move was slightly larger. Do you you what else moved at that same time? That was the last time the Yen strengthened due to intervention. Do you think there is a coincidence? I don’t.
3/ It’s a Rotation Game
Having spent 20 years at hedge funds, I know that when some parts of the fund are getting stopped out of their positions, all parts of the fund will be reducing risk. Thus, large moves in one area impact risk-taking all over the fund. In the example above, I showed you how the equity long-short investors have been reducing risk as evidenced by the move in the short interest factor. Do we see other moves?


Source: StayVigilant.Substack.com, Bloomberg
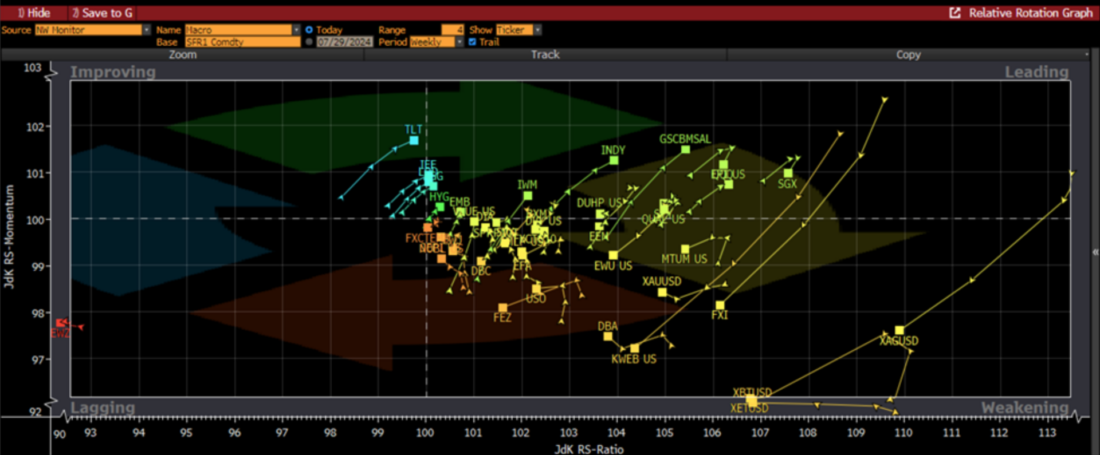
For this I like to look at the relative rotation graph. I have a worksheet on my Bloomberg that plots a number of different asset classes, indices, styles and factors. I want to see how the money is moving. In the RRG, the most interesting areas are the lower right and the upper left. The lower right are the assets that have been leading but are starting to show weakness. These are the potentially crowded longs that are at risk of being closed. In the upper left are the assets that have been lagging and where money is now flowing so that they improve. These may be shorts that are being covered or underweights that are being added to.
We can see in blue the assets that have moved into the improving category are all fixed income ETF. This could be because the market is teeing up a cut in the Fed Funds A cut in the Fed Funds may also be a reason that USD/JPY is falling in the first place. Where is the money coming to buy these bonds? From the best performers that are now suffering. These asset include cryptocurrencies, Chinese ETF and precious metals. All have been high fliers at one point, but now, on a relative basis, their prices are weakening as traders reduce risk.
4/ Everyone’s Favorite Stocks
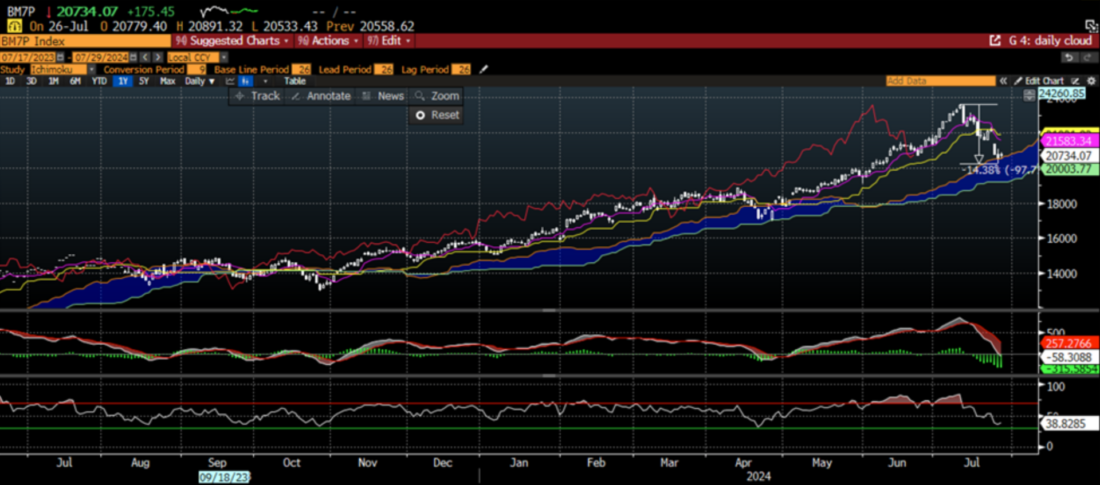
What does that mean for the person on the street? It means that their favorite holdings may also be under pressure from this risk reduction. Here I look at the Bloomberg Magnificent 7 price index. As you can see, this index has fallen almost 15% from recent highs, a considerable correction. This level is still above the average for the year, so an investor who has been dollar-cost averaging in each month is still making money. However, a 15% correction is sometimes enough to bring in some nervousness


Source: StayVigilant.Substack.com, Bloomberg
The good news is the index is still holding the support at the ichimoku cloud. The lagging line is solidly above it and the cloud itself is trending higher. While the MACD in the middle panel has turned lower and looks rather poor, the RSI in the bottom panel is nearing the most oversold levels for this index in the past 1 year. While I would prefer to see it test the downside of the cloud and hold before I added, there are enough positives here to be able to suggest investors are still in good shape.
If we pay attention, markets in other asset classes and around the world can give us unique insights into what is driving the flow of money on a day to day and week to week basis. Armed with this information, investors can make more informed decisions with their portfolios. Stay Vigilant!
About This Week’s Author
Rich Excell, CFA, CMT is a 30-year hedge fund and proprietary trading veteran who has lived and worked in Asia and Europe in addition to the United States. He has run investment businesses spanning equities, fixed income, commodities and foreign exchange. Rich is now a Clinical Assistant Professor of Finance at the Gies College of Business, University of Illinois, Urbana-Champaign. He also is the host of the Investment Exchange Forum and Macro Matters podcasts for the CFA Society Chicago and writes a bi-weekly options trading blog ‘Excell with Options’ for the CME Group. Finally, he writes a weekly Substack blog called ‘Stay Vigilant’ which aims to demystifinance for the average investor.
——————————————-
Originally posted on July 30, 2024
Disclosure: Investopedia
Investopedia.com: The comments, opinions and analyses expressed herein are for informational purposes only and should not be considered individual investment advice or recommendations to invest in any security or to adopt any investment strategy. While we believe the information provided herein is reliable, we do not warrant its accuracy or completeness. The views and strategies described on our content may not be suitable for all investors. Because market and economic conditions are subject to rapid change, all comments, opinions and analyses contained within our content are rendered as of the date of the posting and may change without notice. The material is not intended as a complete analysis of every material fact regarding any country, region, market, industry, investment or strategy. This information is intended for US residents only.
Disclosure: Interactive Brokers
Information posted on IBKR Campus that is provided by third-parties does NOT constitute a recommendation that you should contract for the services of that third party. Third-party participants who contribute to IBKR Campus are independent of Interactive Brokers and Interactive Brokers does not make any representations or warranties concerning the services offered, their past or future performance, or the accuracy of the information provided by the third party. Past performance is no guarantee of future results.
This material is from Investopedia and is being posted with its permission. The views expressed in this material are solely those of the author and/or Investopedia and Interactive Brokers is not endorsing or recommending any investment or trading discussed in the material. This material is not and should not be construed as an offer to buy or sell any security. It should not be construed as research or investment advice or a recommendation to buy, sell or hold any security or commodity. This material does not and is not intended to take into account the particular financial conditions, investment objectives or requirements of individual customers. Before acting on this material, you should consider whether it is suitable for your particular circumstances and, as necessary, seek professional advice.
Disclosure: Forex
There is a substantial risk of loss in foreign exchange trading. The settlement date of foreign exchange trades can vary due to time zone differences and bank holidays. When trading across foreign exchange markets, this may necessitate borrowing funds to settle foreign exchange trades. The interest rate on borrowed funds must be considered when computing the cost of trades across multiple markets.
Disclosure: ETFs
Any discussion or mention of an ETF is not to be construed as recommendation, promotion or solicitation. All investors should review and consider associated investment risks, charges and expenses of the investment company or fund prior to investing. Before acting on this material, you should consider whether it is suitable for your particular circumstances and, as necessary, seek professional advice.


Join The Conversation
If you have a general question, it may already be covered in our FAQs. If you have an account-specific question or concern, please reach out to Client Services.