


")


1/ Mid Cap & Small Cap
2/ AGG Reaches Key Zone
3/ Possible Fall for FEZ?
4/ General Motors Falls
Investopedia is partnering with CMT Association on this newsletter. The contents of this newsletter are for informational and educational purposes only, however, and do not constitute investing advice. The guest authors, which may sell research to investors, and may trade or hold positions in securities mentioned herein do not represent the views of CMT Association or Investopedia. Please consult a financial advisor for investment recommendations and services.
1/
Mid Cap & Small Cap
The S&P 500 remained near the flat line on Tuesday as traders braced for earnings reports from large tech stocks. In contrast, small-cap and mid-cap stocks continue to offer interesting opportunities for investors.
Small-cap stocks are poised for significant growth due to their earnings potential and attractive valuations, while mid-caps present a balanced option with strong financial fundamentals and substantial upside potential.
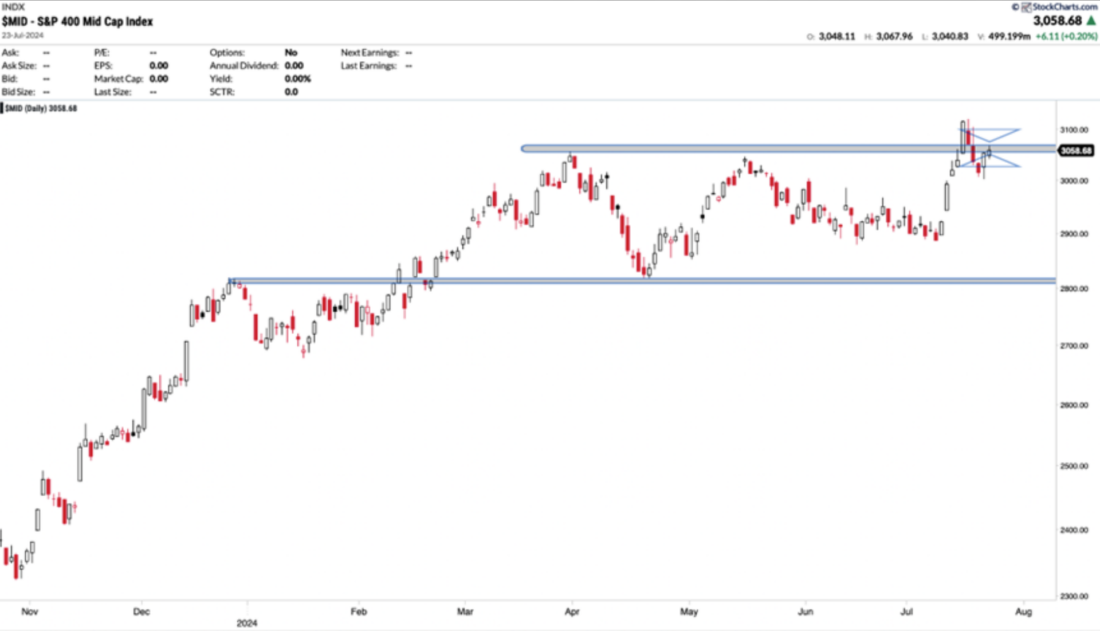
Courtesy of StockCharts.com
Having oscillated sideways within a defined price range for just over two years, their recent breakouts continue to offer appealing risk/reward ratios.
Both indices were the only ones to close with gains on a day when most major indices closed nearly flat. This reinforces recent moves out of ranges and points to further upside in the coming days.

Courtesy of StockCharts.com
The shift to small caps also comes as investors grow increasingly excited that the Federal Reserve will soon begin lowering interest rates, a move seen as particularly helpful for smaller and more cyclically oriented companies.
2/
AGG Reaches Key Zone
Bond prices and interest rates have an inverse relationship. When interest rates fall, bond prices rise, and vice versa. Therefore, when the price of the AGG ETF (iShares Core U.S. Aggregate Bond ETF), which represents a broad spectrum of the U.S. bond market, rises, it can indicate various economic and financial implications.
If the price of AGG is rising, it could be a sign that interest rates are falling or are expected to fall.

Courtesy of StockCharts.com
The price has reached a zone where the VWAP drawn from the 2020 highs coincides with a resistance that has previously contained any attempts to reverse the prevailing trend.
If the Fed ultimately decides to cut rates, we could see AGG break forcefully above this zone and aim for previous highs.
3/
Possible Fall for FEZ?
The FEZ ETF tracks the Euro STOXX 50 Index, which includes 50 of the largest and most liquid stocks in the Eurozone. It provides investors with broad exposure to leading companies in various sectors across Europe, making it a popular choice for those looking to invest in European equities.
FEZ is currently considered undervalued by several analysts, suggesting potential for further gains. Recent strong economic indicators from major European economies, including robust retail sales data from the UK and positive earnings reports from several key European companies, have buoyed investor sentiment.

Courtesy of StockCharts.com
However, what catches my attention is that momentum has been falling since the end of March. This scenario has repeated twice in the last three years, and the immediate consequence has been a pullback.
The SPDR Euro STOXX 50 ETF (FEZ) remains a strong candidate for investors seeking diversified exposure to European markets. With its solid recent performance, attractive valuation, and positive economic indicators, it presents opportunities. However, due to the reduction in momentum, I would pay attention and avoid adding additional capital while tightening stop losses.
4/
General Motors Falls
General Motors stock was down 6.4%. The automaker raised its outlook for the year after reporting second-quarter pretax adjusted earnings of $3.06 per share, surpassing analysts’ estimates of $2.70. GM now expects to generate $13 billion to $15 billion in operating profit for 2024, up from its previous guidance range of $12.5 billion to $14.5 billion. However, cautious commentary about the company’s operations in China contributed to the stock decline.

Courtesy of StockCharts.com
The price has fallen from its 52-week high, indicating a possible throwback to the recently broken level, which now acts as support. Despite concerns over momentum, GM remains a strong candidate for investors seeking exposure to the automotive sector. The company’s continued innovations in electric vehicles and strategic partnerships are expected to drive long-term growth. The consensus among Wall Street analysts is a “Moderate Buy” rating for GM, with an average price target of $55.61.
—
Originally posted 24th July 2024
Disclosure: Investopedia
Investopedia.com: The comments, opinions and analyses expressed herein are for informational purposes only and should not be considered individual investment advice or recommendations to invest in any security or to adopt any investment strategy. While we believe the information provided herein is reliable, we do not warrant its accuracy or completeness. The views and strategies described on our content may not be suitable for all investors. Because market and economic conditions are subject to rapid change, all comments, opinions and analyses contained within our content are rendered as of the date of the posting and may change without notice. The material is not intended as a complete analysis of every material fact regarding any country, region, market, industry, investment or strategy. This information is intended for US residents only.
Disclosure: Interactive Brokers
Information posted on IBKR Campus that is provided by third-parties does NOT constitute a recommendation that you should contract for the services of that third party. Third-party participants who contribute to IBKR Campus are independent of Interactive Brokers and Interactive Brokers does not make any representations or warranties concerning the services offered, their past or future performance, or the accuracy of the information provided by the third party. Past performance is no guarantee of future results.
This material is from Investopedia and is being posted with its permission. The views expressed in this material are solely those of the author and/or Investopedia and Interactive Brokers is not endorsing or recommending any investment or trading discussed in the material. This material is not and should not be construed as an offer to buy or sell any security. It should not be construed as research or investment advice or a recommendation to buy, sell or hold any security or commodity. This material does not and is not intended to take into account the particular financial conditions, investment objectives or requirements of individual customers. Before acting on this material, you should consider whether it is suitable for your particular circumstances and, as necessary, seek professional advice.
Disclosure: ETFs
Any discussion or mention of an ETF is not to be construed as recommendation, promotion or solicitation. All investors should review and consider associated investment risks, charges and expenses of the investment company or fund prior to investing. Before acting on this material, you should consider whether it is suitable for your particular circumstances and, as necessary, seek professional advice.


Join The Conversation
If you have a general question, it may already be covered in our FAQs. If you have an account-specific question or concern, please reach out to Client Services.