


Problems with the “supply chain” have been a key topic among investors, consumers, business managers, and political leaders. While we cannot offer an easy fix for what is an extremely complex and global issue, we can identify some potentially useful quantitative metrics to watch to help track developments in the supply chain, rather than relying on interesting but unreliable anecdotal evidence (e.g. what product you couldn’t find at the store yesterday).
Supplier Deliveries
One set of indices to monitor are the Supplier Deliveries indices within the ISM Manufacturing and Non-Manufacturing (Services) surveys. These are derived from the monthly ISM Report on Business which captures survey responses from hundreds of corporate executives about whether different aspects of their business are improving, deteriorating, or about the same. The results are used to construct diffusion indices (net percent indicating increases/improvement) that range between 0 and 100.
The Supplier Deliveries indices capture the proportion of companies saying that their suppliers are taking longer to deliver orders to the company. Thus they should be a reasonable measure of supply chain issues. Readings above 50 mean more companies are seeing longer supply delivery times (indicating suppliers having trouble keeping up with demand) than are seeing shorter delivery times.
The top chart below shows the Supplier Delivery indices for Manufacturing companies (top section) and Services (Non-Manufacturing) companies (bottom section). The Non-Manufacturing data was first published in 1997, so both series are plotted since then. We can see that both are extremely high versus their normal ranges over the last 24 years, and have returned to the levels seen in the initial COVID-driven spike last year. In fact, the Manufacturing Supplier Deliveries index, which has data back to 1948, is currently near its highest sustained readings since the early 1970s.
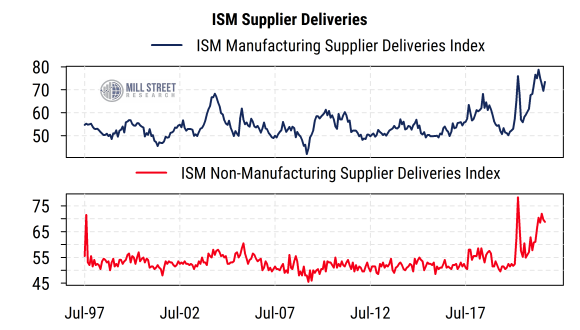
Source: Mill Street Research, Institute for Supply Management, Factset
We would need to see these indices turn meaningfully lower to argue that supply chain concerns were fading, and so far we have not seen such a turn.
Shipping Costs
With overseas shipping and subsequent movement (via truck or rail) of imports and exports now a key choke point, we can also monitor the cost of shipping a standard 40-foot shipping container as a proxy for supply chain costs. The data below are from Freightos, which provides aggregate data on the average cost of shipping containers globally across various routes. The chart plots the cost of shipping a container from China (the source of many US imports) to the US West Coast, from the West Coast to China, and the global average cost across many routes (including many non-US routes).
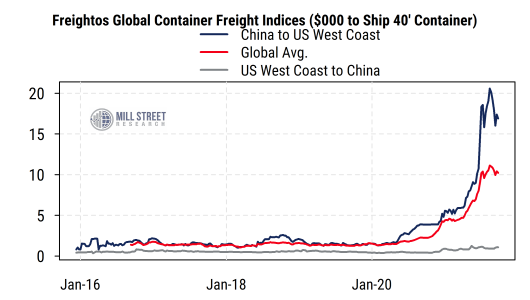
Source: Mill Street Research, Freightos Baltic Index, Bloomberg
We can see first the huge jump in shipping costs in recent months based on the global average (red line). It has moved from a typical pre-COVID cost of around $1500 up to more than $10,000. But this average hides some wide disparities, which reflect the pattern of global trade. The cost of shipping from China to the US has surged even more, from the same levels around $1500 up to nearly $20,000 recently (currently around $17,000). But the cost of shipping from the US back to China has moved far less, rising from around $500 to around $1000 currently. This reflects the relative flows of goods trade between the US and China as well as the problems with distribution in the US once containers arrive here (e.g. lack of trucking capacity to move containers to their final destinations, etc.).
Inventories
Other measures of supply issues we can track are the inventory/sales (I/S) ratios published monthly by the US Census Bureau (currently as of August 2021). They estimate the ratio of the dollar value of inventories held by companies to their monthly sales, so the ratio reflects how many months worth of sales they have on hand. The Census Bureau calculates a total figure for all businesses as well as three subcategories: Manufacturing, Wholesale, and Retail. The chart below plots the historical trends in the I/S ratios for the three categories and the total.
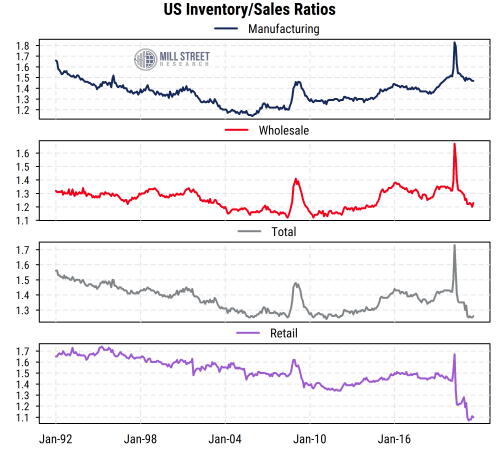
Source: Mill Street Research, US Census Bureau, Factset
While the total I/S ratio (grey line) has fallen and is back near levels seen in the first decade of the 2000s, there are revealing divergences among the three categories. The I/S ratio for manufacturers (blue line) is actually still quite high relative to its historical range, signaling plenty of inventory for sale at US manufacturing companies. The Wholesale category (those who buy from manufacturers or importers and sell to retailers, red line) has declined recently but is near the middle of its historical range. The biggest change by far is in the Retail category (purple line), where the I/S ratio has plunged to new all-time lows (at least since 1992). That means retail firms have much less inventory than usual (barely one month’s worth of sales currently) as consumers have been buying more but retailers have been unable to restock as fast. Since a significant part of what retailers sell is imported and thus subject to global supply chain constraints, and consumer spending has been most directly supported by fiscal and monetary stimulus efforts, it is not surprising that the Retail category is where the most dramatic supply chain effects on inventory are being seen. It is thus where we need to watch most closely for signs of normalization in the coming months.
No clear turn yet
While these metrics are only a few of the many being watched to track the impact of supply chain disruptions on the economy, they all tell a similar story: companies are seeing much slower supply deliveries, which has led to much lower inventories among retailers, and a much higher cost of shipping goods overseas (and within the US). None of them has yet turned decisively back toward more “normal” readings, so we should expect supply-related issues to persist a while longer.
—
Originally Posted on October 28, 2021 – Tracking The Supply Chain
Disclosure: Mill Street Research
Source for data and statistics: Mill Street Research, FactSet, Bloomberg
This report is not intended to provide investment advice. This report does not constitute an offer or solicitation to buy or sell any securities discussed herein in any jurisdiction where such offer or solicitation would be prohibited. Past performance is not a guarantee of future results, and no representation or warranty, express or implied, is made regarding future performance of any security mentioned in this report.
All information, opinions and statistical data contained in this report were obtained or derived from public sources believed to be reliable, but Mill Street does not represent that any such information, opinion or statistical data is accurate or complete. All estimates, opinions and recommendations expressed herein constitute judgments as of the date of this report and are subject to change without notice.
Disclosure: Interactive Brokers
Information posted on IBKR Campus that is provided by third-parties does NOT constitute a recommendation that you should contract for the services of that third party. Third-party participants who contribute to IBKR Campus are independent of Interactive Brokers and Interactive Brokers does not make any representations or warranties concerning the services offered, their past or future performance, or the accuracy of the information provided by the third party. Past performance is no guarantee of future results.
This material is from Mill Street Research and is being posted with its permission. The views expressed in this material are solely those of the author and/or Mill Street Research and Interactive Brokers is not endorsing or recommending any investment or trading discussed in the material. This material is not and should not be construed as an offer to buy or sell any security. It should not be construed as research or investment advice or a recommendation to buy, sell or hold any security or commodity. This material does not and is not intended to take into account the particular financial conditions, investment objectives or requirements of individual customers. Before acting on this material, you should consider whether it is suitable for your particular circumstances and, as necessary, seek professional advice.
