


There are times when the best market move seems crystal clear. For a while it was to buy big tech stocks, close your eyes, and hold on. As we learned last week and yesterday, that of course works until it doesn’t. Then there are times when the path is much murkier. That’s what we’re looking at now.
This morning’s equity market has been trying its best to digest yesterday’s rout. As I type this, the major tech stocks recovered from an early swoon while small caps led the way. Although the final outcomes were worse than what we noted around midday yesterday, declining stocks never outpaced advancers at the sort of levels that we see during extreme selloffs. Even as the S&P 500 (SPX) had its first drop of greater than -2% since December 2022, the ratio of losers to winners was about 4:1. Today, that ratio has flipped to about 2.5:1 positive, with the Russell 2000 up about +2% and the Russell 1000 Value ETF (VONV) is up about +1% even as its Growth counterpart (VONG) is roughly flat. The rotation continues, even as the ”routation” takes a breather.
It makes sense that the value and small cap sectors would outperform on a day where we received some positive economic news. Second quarter GDP came out at 2.8%, well above the 2.0% consensus estimate. That said, according to my colleague Jose Torres, inventories almost entirely accounted for the bump. Perhaps that is why bonds barely flinched, remaining higher (lower yields) after an overnight flight to safety, and why probabilities for rate cuts barely budged. Data dependent or not, the market has decided that rate cuts are coming, even if that data included a 2.9% quarterly rise in the Core PCE Price index (down from last quarter’s 3.7% but above the 2.7% consensus. Futures continue to price in a slight probability for a cut next week, the certainty of a cut in September, and a high likelihood for cuts at the two subsequent meetings this year.
Speaking of bonds, we have seen a remarkable development in recent weeks. The yield curve, at least as measured by the spread between 2- and 10-year Treasury yields, has been disinverting in a hurry. The 2-year yields exceeded 10-year yields by about 50 basis points at the start of the month. As of yesterday, that was down to about 14bp before improving. That might sound great, but the chart below reminds us that recessions begin after the curve returns to normality.
Spread between 2-Year and 10-Year Treasury Yields with NBER Recession Start (red) and End (green) Dates
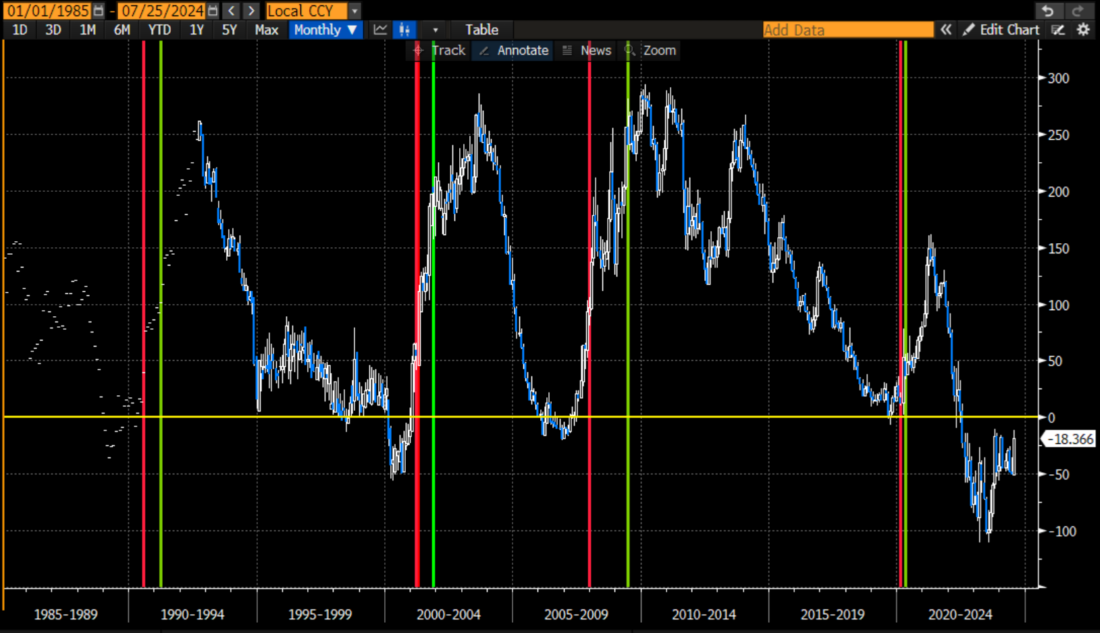
Source: Bloomberg
Even if the backward-looking economic numbers show signs of strength, key commodities markets are saying otherwise. Copper can be a useful tool for gauging global demand, and after a huge run this spring, fueled by AI enthusiasm, that commodity has been steadily given back its recent gains:
COMEX July 2024 Copper Futures, 1-Year Candles

Source: Interactive Brokers
Actually, commodities overall have been falling. One key measure is the Bloomberg Commodities Index (AIGCI on TWS), which has also been dropping. It’s not just copper:
Bloomberg Commodity Index, 1-Year Line

Source: Interactive Brokers
These charts bode well for inflation, but not economic activity. A data-dependent FOMC would likely consider the drops in commodities as part of the overall disinflationary trends, but it is not clear to what extent they might use them as a signal of current economic prospects.
We have been asserting for weeks that next week’s FOMC meeting promises to be quite consequential. Even if rates don’t change, the rhetoric should offer key clues to the degree to which the group is concerned about economic growth and whether they deem inflationary conditions. But in the short-term, watch the Japanese Yen for clues. It is clear that carry traders, those who borrow low-yielding yen to finance higher yielding or riskier investments, are driving the tech market bus right now. Don’t believe me? I’ll drop the mic with the following chart:
Past 13 Days, Japanese Yen (15-Minute blue/white candles) vs. September NQ futures (yellow line)

Source: Bloomberg
Disclosure: Interactive Brokers
The analysis in this material is provided for information only and is not and should not be construed as an offer to sell or the solicitation of an offer to buy any security. To the extent that this material discusses general market activity, industry or sector trends or other broad-based economic or political conditions, it should not be construed as research or investment advice. To the extent that it includes references to specific securities, commodities, currencies, or other instruments, those references do not constitute a recommendation by IBKR to buy, sell or hold such investments. This material does not and is not intended to take into account the particular financial conditions, investment objectives or requirements of individual customers. Before acting on this material, you should consider whether it is suitable for your particular circumstances and, as necessary, seek professional advice.
The views and opinions expressed herein are those of the author and do not necessarily reflect the views of Interactive Brokers, its affiliates, or its employees.
Disclosure: Futures Trading
Futures are not suitable for all investors. The amount you may lose may be greater than your initial investment. Before trading futures, please read the CFTC Risk Disclosure. A copy and additional information are available at ibkr.com.
Disclosure: ETFs
Any discussion or mention of an ETF is not to be construed as recommendation, promotion or solicitation. All investors should review and consider associated investment risks, charges and expenses of the investment company or fund prior to investing. Before acting on this material, you should consider whether it is suitable for your particular circumstances and, as necessary, seek professional advice.
Disclosure: Forex
There is a substantial risk of loss in foreign exchange trading. The settlement date of foreign exchange trades can vary due to time zone differences and bank holidays. When trading across foreign exchange markets, this may necessitate borrowing funds to settle foreign exchange trades. The interest rate on borrowed funds must be considered when computing the cost of trades across multiple markets.


Join The Conversation
If you have a general question, it may already be covered in our FAQs. If you have an account-specific question or concern, please reach out to Client Services.