


Friday’s close on the Cboe Volatility Index (VIX) caught my eye. It finished the week at 11.99, the first time that VIX closed with an 11 handle since November 2019 – just before that year’s Thanksgiving holiday. While US markets are closed for Memorial Day next Monday[i], I don’t believe that is playing an active role in the suppression of implied volatilities in the marketplace. Like most other market factors, it’s mostly about supply and demand.
There is a crucial point about VIX that we would like to stress: It is our contention that VIX is a barometer for institutions’ demand for protection. I have often stated that “VIX is not a fear gauge, it just plays one on TV.” That is not to be dismissive of the media’s reporting on VIX. It does tend to rise when fears intrude into investors’ psyches, but it is not explicitly constructed to reflect sentiment. Instead it is designed to reflect the market’s best estimate of anticipated volatility over the coming 30 days. Since we tend to have asymmetric reactions to market moves – sharp upward moves can be considered “socially acceptable volatility” because investors perceive that markets are supposed to go up – VIX tends to rise when markets get rocky. That increases the perception that volatility will be elevated over the coming days, but it is more likely that VIX is rising as investors reconsider their risk exposures.
If we want to see the relative availability of volatility protection, we look to the term structure of VIX futures. When VIX, or most other commodities, are in contango – meaning that the curve slopes upwards from left to right – it means that the commodity in question has a relatively plentiful short-term supply relative to demand. We see that VIX futures are currently in contango, except for those that cover the period around the upcoming Presidential election. In the graph below, note how both the levels of VIX futures AND the shapes of the curves have changed in the course of a month:
VIX Futures Term Structure, Today (yellow), 1-Month Ago (magenta)
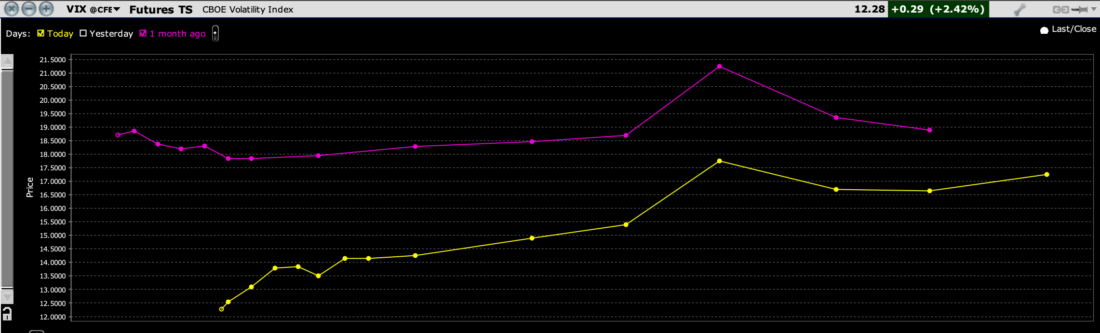
Source: Interactive Brokers
Remember that one month ago we were nearing the end of a very rocky April, while today we are once again at or near all-time highs on many key indices. We see that there was slight backwardation in the near-term futures, meaning that demand for volatility protection was outpacing supply in the short-term, even if the absolute level of VIX was well below other selling climaxes. Now we see a very steep near-term contango, meaning that short-term protection is clearly abundant.
Why the abundance? Partly it’s “animal spirits.” Things feel good, so why hedge? No one is thinking about umbrellas when clear skies prevail. The same is true for volatility protection.
But that only explains the lack of demand. It doesn’t explain the abundant supply. The recent popularity of funds that utilize volatility-selling strategies explains that.
A paper published by the Bank for International Settlements (BIS) provides a significant amount of data. They show the relative explosion in money that has flowed into ETFs that utilize covered call selling strategies. While they’re at it, they puncture the myth that so-called “zero-dated” or “0DTE” options have “broken” VIX. Note the recent explosion in what they term “1MTE” options – one-month to expiration, the period measured by VIX:

Source: Bank for International Settlements
To me, the key graph is the one on the left, where the blue line (cumulative flows to covered call ETFs) rises sharply as the level of VIX falls. It’s not prima facie evidence that the call-writing strategies are the single cause of the low VIX readings, but they must play a key role. If there is plenty of volatility (or anything) for sale, it pressures the price. Hence the lower-trending VIX.
On the surface this should not be a major concern. But look at the track record of low VIX readings. They are almost inevitably followed by spikes in volatility.
VIX, Weekly Candles Since 2006

Source: Interactive Brokers
Does this mean that panic time is approaching? In and of itself, no. But with Nvidia’s (NVDA) earnings approaching this week, where disappointment could upend the market’s mentality about all things AI-related, we do seem a bit sanguine. (The same is the case with that stock’s options.) People seem greedy rather than fearful. I think Warren Buffett had something to say about that, no?
—
[i] I hope my Canadian friends are enjoying Victoria Day today
Join The Conversation
If you have a general question, it may already be covered in our FAQs. If you have an account-specific question or concern, please reach out to Client Services.
Leave a Reply
Disclosure: Interactive Brokers
The analysis in this material is provided for information only and is not and should not be construed as an offer to sell or the solicitation of an offer to buy any security. To the extent that this material discusses general market activity, industry or sector trends or other broad-based economic or political conditions, it should not be construed as research or investment advice. To the extent that it includes references to specific securities, commodities, currencies, or other instruments, those references do not constitute a recommendation by IBKR to buy, sell or hold such investments. This material does not and is not intended to take into account the particular financial conditions, investment objectives or requirements of individual customers. Before acting on this material, you should consider whether it is suitable for your particular circumstances and, as necessary, seek professional advice.
The views and opinions expressed herein are those of the author and do not necessarily reflect the views of Interactive Brokers, its affiliates, or its employees.
Disclosure: Options (with multiple legs)
Options involve risk and are not suitable for all investors. For information on the uses and risks of options, you can obtain a copy of the Options Clearing Corporation risk disclosure document titled Characteristics and Risks of Standardized Options by clicking the link below. Multiple leg strategies, including spreads, will incur multiple transaction costs. "Characteristics and Risks of Standardized Options"


Huge VIX Puts OI expiring Wednesday must monetize. Look for VIX spike into Wednesday’s OpEx.
This article seems to contradict itself. It admits that VIX was at the same level in 2019 when there were no option-writing ETFs, then claims that the current VIX level is likely caused by inflows into those ETFs.
The VIX is simply an aggregated calculation derived from the market price of options themselves, reflecting the market’s expectation of future volatility. In the case of the index it is a model the CBOE developed to have a fixed price for settlement of futures trades. It’s a forward-looking measure and can change based on market sentiment and economic events. The vix traded lower than this through much of the period between 2017 and 2020. In rising markets volatility shrinks and in falling markets volatility rises as there becomes more demand for hedges.
Particularly in the case of the VIX etf and related etf’s because of transaction costs and the shrinkage of option premium as an option approaches expiration even if the market stays the same the VIX will usually fall. So you have a built in bias to be short volatility as the payoff is asymmetrical weighted to the short position.
It is today one of the most crowded trades, maybe even more crowded than long Nvidia.
I welcome more technical analysis on the options market, thank you. YouTube is stuffed full of videos promoting the selling of covered calls, and how it is easy money; so your suggestion that there could be a correlation with the VIX makes perfect sense. Tom Lee (CNBC contributor) has a wide influence among retail investors and he has been bullish on equities since the start of the year -citing sidelined cash coming back into play – which has driven sentiment positive. However, volatility hasn’t gone away and downside protection looks cheap at a time when one piece of bad news, like underwhelming forward guidance from NVDA, could start a panic. Maybe buy some before IV spikes.