


Earlier this week, we highlighted some of the key divergences that we see amidst the equity market. Today we’ll point out some more.
A key point that we made in the prior piece was that the current rally has become increasingly top-heavy. The large-cap S&P 500 Index (SPX) has outpaced its Midcap (MID) and Small Cap (SML) counterparts, while all are being trounced by the Magnificent 7 ETF (MAGS). The current year-to-date performances are +13.5%, +3.8%, -1.93% and +33%.
Year-to-date Normalized Chart, SPX (white), MID (blue), SML (red), MAGS (purple)
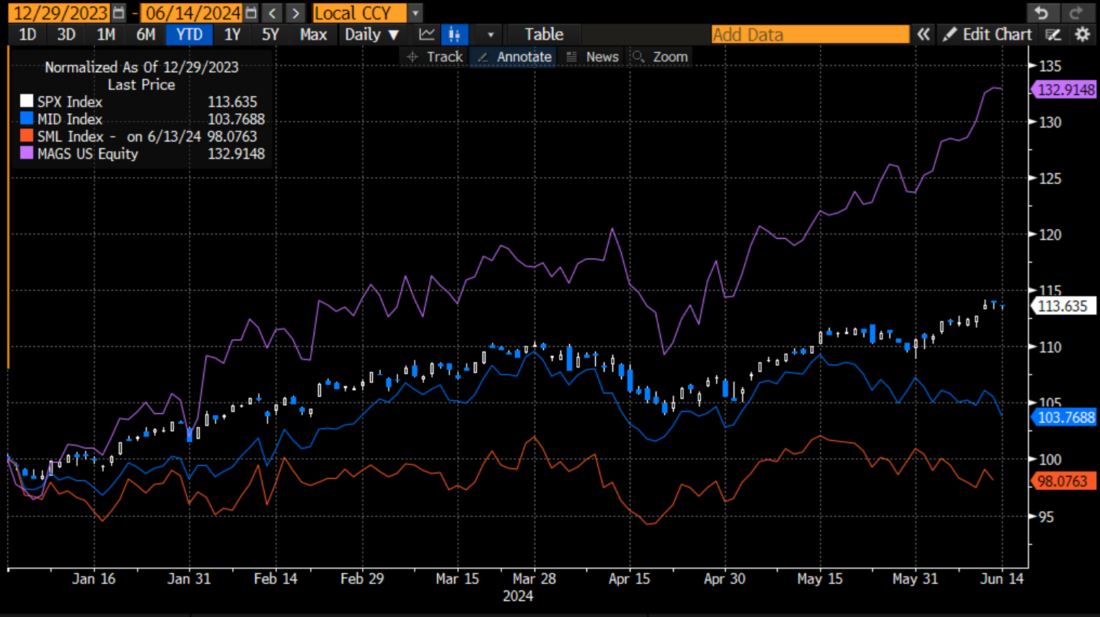
Source: Bloomberg
The positive takeaway from that chart is that if you’ve invested in the correct stocks, particularly if they’re large, AI-related tech stocks, you’ve done superbly. I’ve said many times before that “it’s Nvidia’s (NVDA) market and we’re all just trading in it.” Sure, it’s not only NVDA. Lately it’s Apple (AAPL) and Broadcom (AVGO), among others, but they’re all singing from the same artificial intelligence hymnal. And so are many investors.
Unfortunately, we found another chart that points the narrowing leadership. The top portion of the chart shows the performance of SPX and the Nasdaq 100 (NDX) indices since the current rally began on November 1st of last year. The lower charts show the cumulative advance/decline lines of both indices. We see how the respective A/D lines roughly track the indices, moving higher along when the index advanced and falling when it fell. But something changed in mid-May. The A/D lines stopped following their corresponding indices. Both have so far failed to confirm the indices’ current peaks and are actually slightly lower.
SPX (white) and NDX (yellow) Since November 1, 2023, with Respective Cumulative Advance/Decline Lines Below
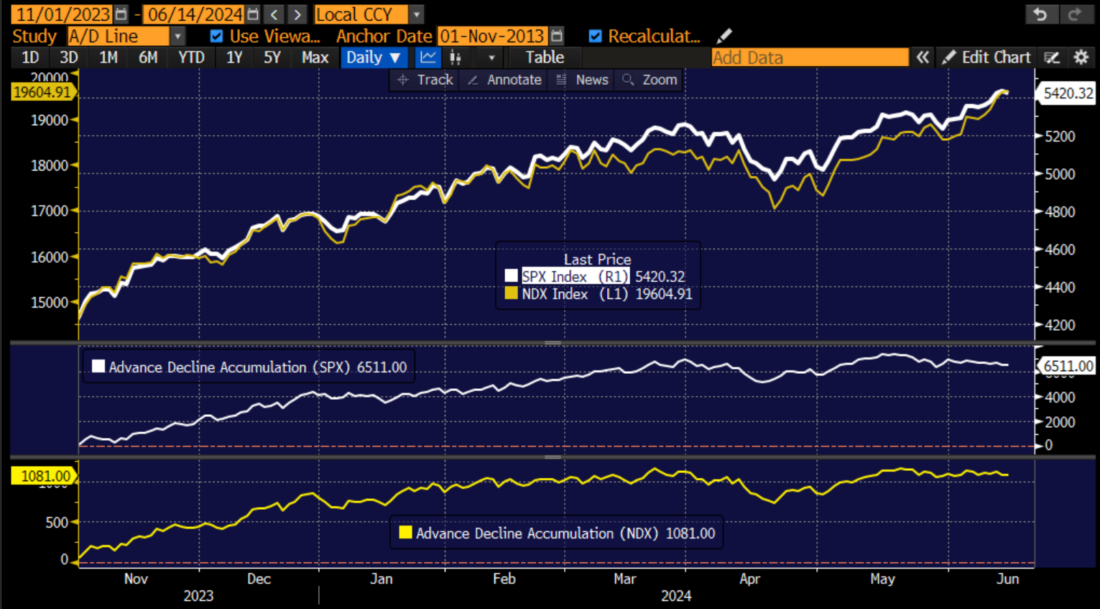
Source: Bloomberg
This doesn’t prove that we are in imminent danger, but this is a negative sign. This can only occur if the larger, more heavily weighted index leaders lead the advance, even if the others lag. It is wonderful when it works, but treacherous. If everyone is fully long a narrow group of market leaders, who is left to buy them if they stop going up? Or fall?
Finally, we will highlight a version of the old-school Dow Theory. It posits that new highs in the Dow Jones Industrial Average (INDU) need to be confirmed by highs in the Dow Transports and Utilities. I agree with the basic merits of the theory, since those two sectors reflect the general health of the economy, but since I loathe the price-weighted construction of those “indices”, we will use SPX alongside its Transportation and Utilities components. We see that the transports stopped confirming the advance when we bounced off the April lows, and after a brief AI-fueled enthusiasm, we now see the utilities failing to confirm as well:
SPX (blue) Since November 1, 2023, with S&P Transportation (white) and S&P Utilities (red)
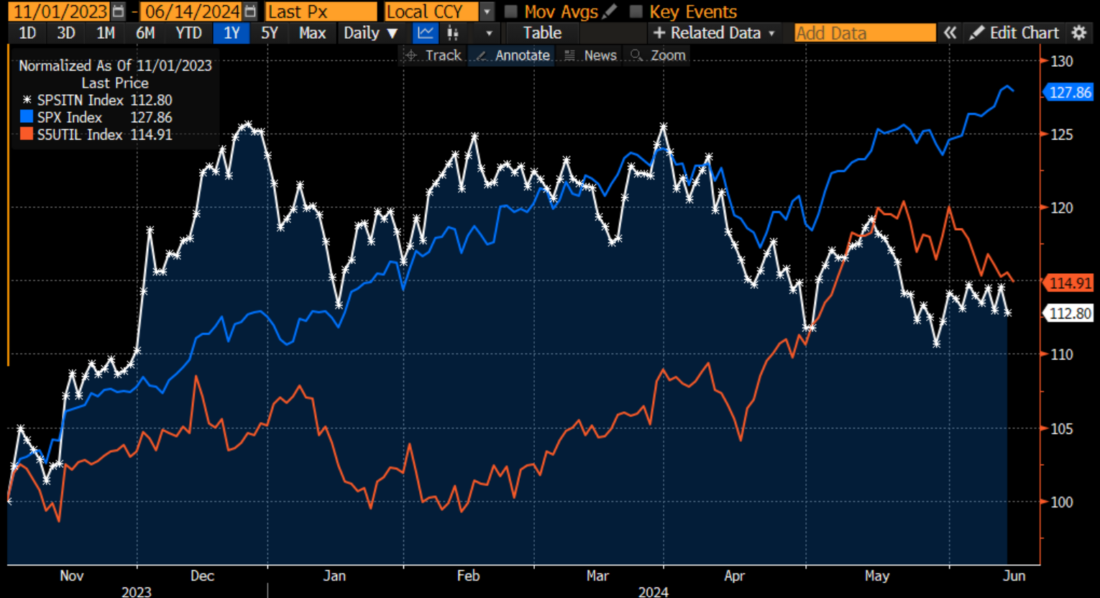
Bottom line here, there are many signs of weakness that would give pause to a long-time market watcher. This is why, on the morning after the FOMC meeting, I asserted that the market rally is dependent on AI, not rate cuts. Yes, “it’s NVDA’s market and we’re all just trading in it,” so we need to be very wary if the enthusiasm wanes.
Join The Conversation
If you have a general question, it may already be covered in our FAQs. If you have an account-specific question or concern, please reach out to Client Services.
Leave a Reply
Disclosure: Interactive Brokers
The analysis in this material is provided for information only and is not and should not be construed as an offer to sell or the solicitation of an offer to buy any security. To the extent that this material discusses general market activity, industry or sector trends or other broad-based economic or political conditions, it should not be construed as research or investment advice. To the extent that it includes references to specific securities, commodities, currencies, or other instruments, those references do not constitute a recommendation by IBKR to buy, sell or hold such investments. This material does not and is not intended to take into account the particular financial conditions, investment objectives or requirements of individual customers. Before acting on this material, you should consider whether it is suitable for your particular circumstances and, as necessary, seek professional advice.
The views and opinions expressed herein are those of the author and do not necessarily reflect the views of Interactive Brokers, its affiliates, or its employees.


Good article! Thanks!
Thanks for engaging!
Thank you
Thank you for article. Equal weighted RSP is as well anothet gauge when placed next to SPY to see breadth of SPX at a glance. It was quite skewed between the two today.
Thanks for engaging!
Bought extra protection today
Since May 31 — the Dow is down, the SPY is up 2.8 percent and the QQQ is up 6.4 percent. 6.4 PERCENT IN TWO WEEKS. A guest on CNBC today said, “The sky’s the limit with AI.” Not kidding. Someone actually said that. NVDA options are downright scary. It was up a little over $2 today, and a September 200 call was up 30% (!!!) HUH!!?? They added yet another option strike today for NVDA. Before today they went up to $250. Today they added one for $255. I’d like someone to explain to me with a straight face why that was necessary. $200 would be a $5 TRILLION DOLLAR VALUATION. That would be $625 for every man, woman and child on the planet. JUST NVDA. JUST THAT ONE SEMICONDUCTOR COMPANY. As I posted many months ago, this is an election year, and stocks will probably be up. I now see all of the markings of another major tech bubble that will eventually implode, possibly worse than the bubble of 1999/2000.
most of the talking heads and retail traders give you a blank look if you make the comparison to CSCO around 2000. The internet was going to (and did) change the world, and CSCO was the most valuable stock on earth, and was never going to not be. Pull up a max chart of CSCO and ask yourself how NVDA and CSCO are different and the same decades apart.
The top 3 mega cap tech stocks now have a combined valuation of almost $10 TRILLION. That is $1250 for every man, woman and child on the planet. Just those THREE COMPANIES. Let’s review some basics: If you stacked a Trillion dollars worth of THOUSAND DOLLAR BILLS one on top of the other it would reach an altitude of 65 MILES. (That is higher than where Jeff Bezos’ Spaceship goes!) If you traveled at the speed of light–186,000 mile per second–it would take you 62 days to travel One Trillion miles!
The article is merely rolling over what is completely obvious to anyone with one eye on the market. What’s lacking is helping to point us in some direction: buy more/sell and take profits? What bothers me is that the bad news keeps rolling in especially with retailers, food cos and restaurants, but at the same time the economy is called ‘strong.’ The obvious fact is that the consumer is more than stretched but the markets don’t seem to care. You know you’re walking on thin ice when a third-rate economy, France, has a political explosion and the market can’t stop talking about it. How will the market react when something dealing with money occurs; bank collapse, private equity issues surfacing.
I think the huge divergence of late in the Russell is probably the biggest warning sign, and was not even mentioned in the article
There have been many other articles that mentioned the divergence of the Russell 2000. It is without a doubt one of many warning signs. Historically, the IWM has been valued at about 50% of the SPY. In fact, in 2021, the SPY reached a peak of $480. The IWM reached a peak of $244, more than 50% of the SPY. Look at them now. The IWM is trading as if the SPY was just $400. The IWM’s price is just 36% of the SPY’s price right now. That is near an all-time low. When I listen to the talking heads on CNBC, most say it is all due to interest rates, most of the small caps lose money and have a lot of debt, stick with the large caps, blah blah blah. Well to me, that is another sign that this is a very unhealthy stock market beneath the surface. (Furthermore, the 10 year yield has fallen significantly the past few weeks, and the Russell 2000 has gone even lower!) And by the way, many large cap companies have enormous debt too, mind boggling debt that they will never, ever be able to repay. And many mid cap and even large cap companies are not profitable. So the argument from the talking heads regarding the Russell 2000 is predicated on a completely false premise. I believe the Silicon Valley AI story is grossly and unjustly exaggerated, and when people finally figure this out, lookout below.