


")


In the tech industry, six American companies have achieved valuations of at least $1 trillion, with five of them surpassing the $2 trillion mark.
These giants—Apple, Microsoft, Alphabet, Meta, Nvidia and the latest $2 trillion member, Amazon—are not only leaders in their fields but also pivotal in driving innovation, shaping market trends, and influencing investor sentiment.
Though they dominate the S&P 500 and Nasdaq 100 now, will they maintain this lead, or will new contenders or startups disrupt their reign?
What Do Seasonals Say?
Despite generating more revenue than its peers, Amazon’s lower profitability has historically kept its valuation in check. However, recent strategic changes are boosting its bottom line, and its growing role in AI is drawing investor attention.
So, is now the best time to invest ?
There are mixed feelings when it comes to an answer.
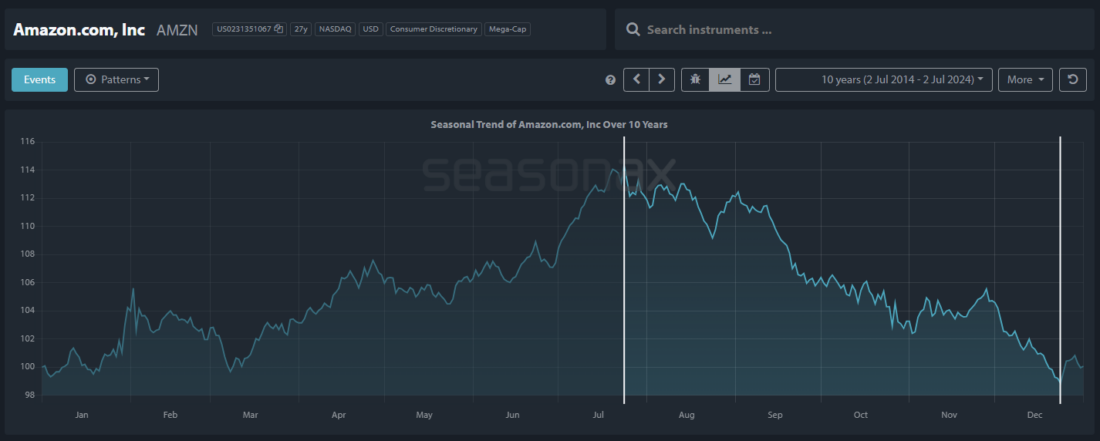
Amazon’s stock benefits from seasonal trends, especially during the first half of the year (January to July). However, the second half tells a different story.
Over the past decade, from July 24 to December 24, Amazon has averaged negative returns of over -4.24%. This seasonal weakness is crucial for investors to consider.
Amazon – Detrended Seasonal Chart, Calculated Over 10 Years
Source: Seasonax, sign up here https://app.seasonax.com/signup to access further analysis, 30 days for free
How to read detrended seasonal charts? * By using our function to detrend charts, we use statistical methods to separate trend from time. This means that the overarching uptrend will be subtracted out which is especially useful for “high flyer” stocks that show a constant uptrend in the past years.Thereafter you will immediately and quite clearly discern in what time periods the relatively weak phases are located. This way, it is easier to analyze and identify cyclical patterns.
August Chill for Microsoft
According to seasonal trends, August doesn’t look promising for other members of the trillionaire club. Apple, in particular, shows signs of cooling off during this month.
This is strongly visible when using the “detrending” feature in the seasonal charts.
With detrending, you can quickly identify the relatively weakest phases for instruments that have risen significantly in recent years “high flyers”—and may correct downward particularly sharply in weak market phases. Such phases might be of interest for short traders.
Microsoft, Detrended Seasonal Chart, Calculated Over 10 Years

The seasonal weak phases are now clearly visible. Source: Seasonax
Microsoft’s fiscal year ends in June, making the period leading up to it critical as the company strives to meet its targets. This often results in a strong performance and a favorable outlook in the subsequent earnings report in July.
After the earnings have been reported we can see a weaker phase from August 1 until September 29. Over the last 10 years during this period, we have had an average return of -0.9%, particularly pointing at the last 4 years that have been negative.
Microsoft, pattern returns from August 1 until September 29 over the last 10 years

Source: Seasonax , sign up here https://app.seasonax.com/signup to access further analysis, 30 days for free
Afterwards, Microsoft enjoys a robust fourth quarter, thanks to increased consumer and enterprise spending. The holiday season is a prime time for selling Surface devices, Xbox consoles, and software.
Don’t Bite an Apple During September
Apple also tends to perform well in the last quarter of the year. The launch of new products often boosts the stock price, followed by strong sales during the holiday season.
From a seasonal perspective, the weakest period for Apple is just before holiday season from September 2 to October 2.
During this 21 trading days Apple had negative returns of -4.12% during the last 10 years. Also leaving the last 4 years consistently with a negative “taste”.
Apple, Detrended Seasonal Trend, Calculated Over 10 Years

Source: Seasonax, sign up here https://app.seasonax.com/signup to access further analysis, 30 days for free
Making the Most of Seasonal Trends
By understanding the seasonal patterns of trillionaire stocks, you can strategically time your investments for maximum gains. For instance, consider buying stocks before historically strong periods, such as buying Microsoft ahead of earnings reports in October or the holiday season. Conversely, selling or hedging positions before typically weaker periods can protect your portfolio from potential declines.
Utilizing Seasonax will help you pinpoint the best times to enter and exit the market, maximizing your potential returns. As you enjoy the summer festivities, let your investments work for you. Remember, don’t just trade it, Seasonax it!
Test it free for 30 days and explore patterns across various markets, including indices, (crypto)currencies, stocks, and commodities.
—
Originally Posted July 24, 2024 – Welcome to the Trillionaire Club
Disclosure: Seasonax
Past results and past seasonal patterns are no indication of future performance, in particular, future market trends. Seasonax GmbH neither recommends nor approves of any particular financial instrument, group of securities, segment of industry, analysis interval or any particular idea, approach, strategy or attitude nor provides consulting nor brokerage nor asset management services. Seasonax GmbH hereby excludes any explicit or implied trading recommendation, in particular, any promise, implication or guarantee that profits are earned and losses excluded, provided, however, that in case of doubt, these terms shall be interpreted in abroad sense. Any information provided by Seasonax GmbH or on this website or any other kind of data media shall not be construed as any kind of guarantee, warranty or representation, in particular as set forth in a prospectus. Any user is solely responsible for the results or the trading strategy that is created, developed or applied. Indicators, trading strategies and functions provided by seasonax GmbH or on this website or any other kind of data media may contain logical or other errors leading to unexpected results, faulty trading signals and/or substantial losses. Seasonax GmbH neither warrants nor guarantees the accuracy, completeness, quality, adequacy or content of the information provided by it or on this website or any other kind of data media. Any user is obligated to comply with any applicable capital market rules of the applicable jurisdiction. All published content and images on this website or any other kind of data media are protected by copyright. Any duplication, processing, distribution or any form of utilisation beyond the scope of copyright law shall require the prior written consent of the author or authors in question. Futures and forex trading contains substantial risk and is not for every investor. An investor could potentially lose all or more than the initial investment. Risk capital is money that can be lost without jeopardizing ones’ financial security or lifestyle. Only risk capital should be used for trading and only those with sufficient risk capital should consider trading. Past performance is not necessarily indicative of future results. Testimonials appearing on this website may not be representative of other clients or customers and is not a guarantee of future performance or success.
Disclosure: Interactive Brokers
Information posted on IBKR Campus that is provided by third-parties does NOT constitute a recommendation that you should contract for the services of that third party. Third-party participants who contribute to IBKR Campus are independent of Interactive Brokers and Interactive Brokers does not make any representations or warranties concerning the services offered, their past or future performance, or the accuracy of the information provided by the third party. Past performance is no guarantee of future results.
This material is from Seasonax and is being posted with its permission. The views expressed in this material are solely those of the author and/or Seasonax and Interactive Brokers is not endorsing or recommending any investment or trading discussed in the material. This material is not and should not be construed as an offer to buy or sell any security. It should not be construed as research or investment advice or a recommendation to buy, sell or hold any security or commodity. This material does not and is not intended to take into account the particular financial conditions, investment objectives or requirements of individual customers. Before acting on this material, you should consider whether it is suitable for your particular circumstances and, as necessary, seek professional advice.


Join The Conversation
If you have a general question, it may already be covered in our FAQs. If you have an account-specific question or concern, please reach out to Client Services.