


By C. Theodore Hicks II, CFP, CKA, CMT
1/ TSLA
2/ RIVN?
3/ Presidential Years
4/ From May thru October
5/ Without the Outliers
Investopedia is partnering with CMT Association on this newsletter. The contents of this newsletter are for informational and educational purposes only, however, and do not constitute investing advice. The guest authors, which may sell research to investors, and may trade or hold positions in securities mentioned herein do not represent the views of CMT Association or Investopedia. Please consult a financial advisor for investment recommendations and services.
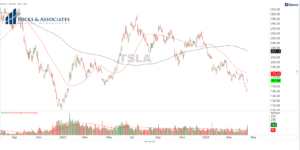
1/
TSLA
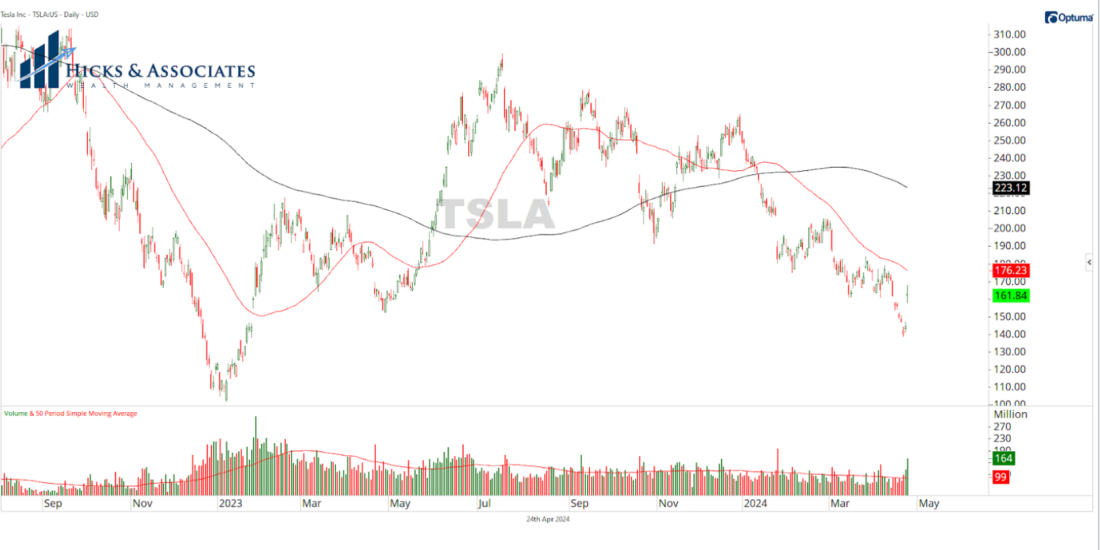
Depending on how you consume your stock market related news, you may have seen that Tesla was up ~12% yesterday. Tesla was one of the darlings of 2023, advancing close to 130% for the year. Year-to-date, however, the stock is down ~35% – yes, even after accounting for yesterday’s ~12% advance.
Given how beat up the stock has been lately, some might think it is a good idea to buy it while it’s down. You know, “buy low so you can sell high”. If you are a regular reader of the Chart Advisor, you may already see enough evidence on the chart. Well, stated differently, there is no evidence on the chart that buying TSLA here is a good idea. You may have hope or a general belief that TSLA will rise between now and whenever you plan to sell (which could arguably be years into the future), but when we are managing money for our clients we do not make decisions based on our hopes or beliefs. We believe in the fundamental laws of supply and demand. We want to see evidence that there is demand for the stock. Right now, all we see is an abundant supply of TSLA with not much demand.
2/
RIVN?

The daily chart for Rivian, one of Tesla’s rivals, reminds us why we would discourage anyone from buying a stock just because it is a bit beaten up.
After the initial fanfare of Rivian’s public offering, this stock has crumbled, falling ~91% from the initial offering price or ~95% from the highs. Even if you did not buy at either of those prices, investing in this stock has been “dead money” for the better part of two years. There is no evidence that this stock is in demand.
Having said that, there is a stark difference between Rivian and Tesla. So, to be clear, I’m not comparing their stocks. RIVN is simply being used to demonstrate that a stock can be down for years. Why buy a stock when there is no evidence that there is demand for it; for it is demand that will push the price up.
By the way, if you are considering an electric vehicle, one look at RIVN’s stock chart suggests that you might not want to buy a Rivian. If there is no demand for the stock, it might be indicative that there is no demand for the vehicles. That, in turn, might put solvency into question.
3/
Presidential Years

Switching topics to politics, because who doesn’t enjoy talking politics, let’s take a look at the US stock market performance (as measured by the S&P 500) during Presidential election years.
Chart 3 shows the S&P 500’s performance for every Presidential election year since 1976. Why 1976? Because that is when I was born.
If we do the math, the average return for these years is ~6.93%. Keep in mind that, through Wednesday, the S&P 500 is up ~6.91% so far this year.
However, to be fair, let’s remove the two recessionary years of 2000 and 2008 as those years were a bit extreme. Doing so pushes the average return to ~13.24%.
However, if we remove the two worst years, we should probably remove the two best years too – especially 1980. So, removing the two worst years and the two best years gives us an average return of ~10.31% for the S&P 500.
4/
From May thru October

Having looked at the full year data, I’m really curious to know about the second half of the year. However, since the US elections are in early November, and since April is almost over, I’m really curious to know if there is a trend or a central tendency for May through October. That data is displayed on Chart 4.
For the period of May 1st through October 31st of the Presidential election years since 1976, the average return for the S&P 500 is ~1.498%. If we remove just the two recessionary years, the average for this six month period is ~5.83%. However, if we remove the two best and the two worst years, the average is ~2.67%.
While I like the idea of removing the outliers, and only looking at the “modern” era, when we look at these years in this manner, we are only looking at 8 years. That’s not a very good sample size.
5/
Without the Outliers

This brings us to Chart 5. If we remove those two best and two worst years, but we expand the data to 1956 – which (I believe) is the first presidential election year since the creation of the S&P 500 – we get data as shown on Chart 5.
If we then do the math for these 13 presidential election years (still not a great sample size, but it’s certainly better than 8), we get an average return for the period of May 1st through October 31st of only ~2.83%.
In conclusion, you might want to review your expectations for what to expect in the stock market over the next six months. This is also a great example of why we practice an active approach to stock & sector selection for, while the next six months might yield muted broad market returns, that does not mean all stocks and all sectors will offer the same.
—
Originally posted 25th April, 2024
Disclosure: Investopedia
Investopedia.com: The comments, opinions and analyses expressed herein are for informational purposes only and should not be considered individual investment advice or recommendations to invest in any security or to adopt any investment strategy. While we believe the information provided herein is reliable, we do not warrant its accuracy or completeness. The views and strategies described on our content may not be suitable for all investors. Because market and economic conditions are subject to rapid change, all comments, opinions and analyses contained within our content are rendered as of the date of the posting and may change without notice. The material is not intended as a complete analysis of every material fact regarding any country, region, market, industry, investment or strategy. This information is intended for US residents only.
Disclosure: Interactive Brokers
Information posted on IBKR Campus that is provided by third-parties does NOT constitute a recommendation that you should contract for the services of that third party. Third-party participants who contribute to IBKR Campus are independent of Interactive Brokers and Interactive Brokers does not make any representations or warranties concerning the services offered, their past or future performance, or the accuracy of the information provided by the third party. Past performance is no guarantee of future results.
This material is from Investopedia and is being posted with its permission. The views expressed in this material are solely those of the author and/or Investopedia and Interactive Brokers is not endorsing or recommending any investment or trading discussed in the material. This material is not and should not be construed as an offer to buy or sell any security. It should not be construed as research or investment advice or a recommendation to buy, sell or hold any security or commodity. This material does not and is not intended to take into account the particular financial conditions, investment objectives or requirements of individual customers. Before acting on this material, you should consider whether it is suitable for your particular circumstances and, as necessary, seek professional advice.


Join The Conversation
If you have a general question, it may already be covered in our FAQs. If you have an account-specific question or concern, please reach out to Client Services.