

")

 and Interactive Brokers Guide")


From SIA Charts
1/ Kinross Gold (K.TO)
2/ Candlestick Chart
3/ Point and Figure Chart
Investopedia is partnering with CMT Association on this newsletter. The contents of this newsletter are for informational and educational purposes only, however, and do not constitute investing advice. The guest authors, which may sell research to investors, and may trade or hold positions in securities mentioned herein do not represent the views of CMT Association or Investopedia. Please consult a financial advisor for investment recommendations and services.
1/
Kinross Gold (K.TO)
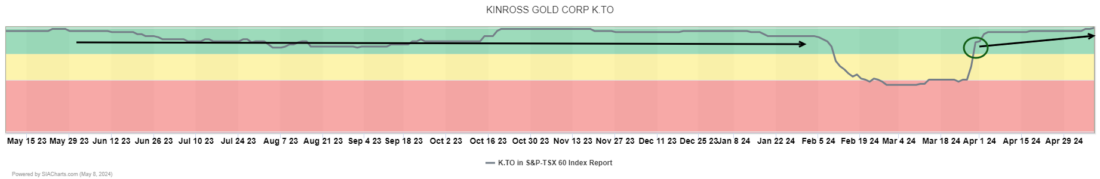
Courtesy of SIA Charts
SIA Charts’ relative strength rankings help investors manage risk by identifying stocks and sectors which are underperforming relative to their peers and/or their benchmarks and should potentially be avoided. Staying away from stocks that are not attracting capital can help investors to avoid areas at higher risk of absolute declines and relative underperformance and to reduce negative event risk.
SIA Charts’ relative strength rankings help investors identify opportunities in stocks which are outperforming their peers or index benchmarks on a relative basis. With the prices of Gold and Silver soaring in recent months, precious metal producers have been climbing in our relative strength ranking tables.
Kinross Gold (K.TO) has bounced back from a winter dip in the SIA S&P/TSX 60 Index Report. It returned to the Green Favored Zone on March 28th and was featured in the Daily Stock Report on April 1st. Since then, the shares have continued to climb up the rankings and yesterday it moved into first place.
2/
Candlestick Chart
Since K.TO was last featured in the Daily Stock Report, its shares have rallied 16.4%, compared with a gain of only 0.3% for the S&P/TSX Composite Index, and a gain of 3.2% in the price of Gold over the same period.
This five-year weekly chart highlights the strength of the current recovery trend in Kinross Gold (K.TO) shares. A big selloff bottomed out in the summer of 2022 and by early 2023 Kinross had broken out of its downtrend. The shares have remained under accumulation over the last year, advancing in a Rising Channel of higher highs and higher lows.
In recent weeks, accumulation has accelerated. Kinross broke out of a bullish Ascending Triangle base clearing $8.25 back in March and has continued to rally since then, taking a run at the $10.00 round number. Next potential upside resistance after that appears near $11.25, the summer 2020 peak near $12.00, or $12.75 based on a measured move from the triangle.

Courtesy of SIA Charts
Point and Figure Chart Extends a Rally
Kinross Gold (K.TO) shares continue to recover. When we last mentioned Kinross in the Daily Stock Report on April 1st, it had just staged a bullish Double Top breakout (lower support line). Since then the shares have been under consistent accumulation, advancing toward $10.00 and taking out previous highs to trade at their highest level since late 2020, extending an uptrend that has been underway for nearly two years. Previous column lows suggest next potential resistance may appear near $10.30, followed by $11.35, which is based on a vertical count, then the 2020 highs near $12.05. Initial support appears near $8.96 based on a 3-box reversal.
3/
Point and Figure Chart
With a perfect bullish SMAX score (which is a near-term 1 to 90-day indicator comparing an asset against different equal-weight asset classes) of 10 out of 10, K.TO is exhibiting short-term strength across the asset classes.

Courtesy of SIA Charts
—
Originally posted 10th May 2024
Disclosure: Investopedia
Investopedia.com: The comments, opinions and analyses expressed herein are for informational purposes only and should not be considered individual investment advice or recommendations to invest in any security or to adopt any investment strategy. While we believe the information provided herein is reliable, we do not warrant its accuracy or completeness. The views and strategies described on our content may not be suitable for all investors. Because market and economic conditions are subject to rapid change, all comments, opinions and analyses contained within our content are rendered as of the date of the posting and may change without notice. The material is not intended as a complete analysis of every material fact regarding any country, region, market, industry, investment or strategy. This information is intended for US residents only.
Disclosure: Interactive Brokers
Information posted on IBKR Campus that is provided by third-parties does NOT constitute a recommendation that you should contract for the services of that third party. Third-party participants who contribute to IBKR Campus are independent of Interactive Brokers and Interactive Brokers does not make any representations or warranties concerning the services offered, their past or future performance, or the accuracy of the information provided by the third party. Past performance is no guarantee of future results.
This material is from Investopedia and is being posted with its permission. The views expressed in this material are solely those of the author and/or Investopedia and Interactive Brokers is not endorsing or recommending any investment or trading discussed in the material. This material is not and should not be construed as an offer to buy or sell any security. It should not be construed as research or investment advice or a recommendation to buy, sell or hold any security or commodity. This material does not and is not intended to take into account the particular financial conditions, investment objectives or requirements of individual customers. Before acting on this material, you should consider whether it is suitable for your particular circumstances and, as necessary, seek professional advice.
Disclosure: ETFs
Any discussion or mention of an ETF is not to be construed as recommendation, promotion or solicitation. All investors should review and consider associated investment risks, charges and expenses of the investment company or fund prior to investing. Before acting on this material, you should consider whether it is suitable for your particular circumstances and, as necessary, seek professional advice.


Join The Conversation
If you have a general question, it may already be covered in our FAQs. If you have an account-specific question or concern, please reach out to Client Services.