


Technical Analysis is a discipline focused on price, volume, and other market data that allows traders and investors to better understand supply and demand relationships in real time. Tyler Wood, CMT chats with Interactive Brokers’ Director of Trading Education Andrew Wilkinson about facts, and some myths, about technical analysis.
Summary – IBKR Podcasts Ep. 56
The following is a summary of a live audio recording and may contain errors in spelling or grammar. Although IBKR has edited for clarity no material changes have been made.
Andrew Wilkinson
Welcome folks to today’s IBKR Podcast and great way to kick off the year with a good colleague and friend of mine Tyler Wood, CMT.
Welcome Tyler, how are you?
Tyler Wood
I’m doing great Andrew, thanks for having me on.
Andrew Wilkinson
You’re very welcome and I’m going to have to point out to the audience here that this is being recorded prior to Christmas, but the role of a technical analyst is to predict the future. So, given that this podcast is going to go out in January, Tyler, let me ask you … how was Christmas?
Tyler Wood
Oh, we had a great time yeah, full of family friends covered in snow. I can already foretell what disasters await me at the family Christmas dinner table, but let’s save that for a different episode.
Andrew Wilkinson
Very good and did you use your Andrew’s pitchfork to move the snow?
Tyler Wood
You’ve been preparing, you’ve been studying for this podcast.
Andrew Wilkinson
I’ve been studying technical analysis for about 30 years, but I never sat the test. Tell us a little bit about the CMT.
Tyler Wood
Sure thing, so I have the great pleasure of representing an organization that has been serving the financial services industry since 1973 officially. Group actually began in the late 1960s with a small team of sell-side equity research analysts. So, it began on Wall Street, and it began because we were at the end of the Go-Go years and a big bull market and at the top you had a lot of speculative firms or “snip and clip clubs” as they were called in the late 60s that were masquerading under the banner of technical analysis, that they had great insights and hot tips on where people could get a great stock return. And so the group that began, what is now the CMT Association or Chartered Market Technicians Association, really wanted some professional recognition and to distinguish what they did from what was available to retail consumers … meaning that there were a lot of myths about technical analysis, a lot of misuse of the tools that really needed to be cleared up. These folks were macroeconomists, they were statisticians. The way I describe it was the original big data farm of Wall Street was in the technician’s office and these people collated and curated price data and then chartered everything by hand. Literally, pencil on paper … graph paper that covered the entire walls of libraries and I’ve had the good fortune of seeing Ralph Acampora’s chart room from the old days with Alan Shaw at what is now Citigroup. But that discipline of studying the message of the market really needed some clarification, some standardization, and that began our association, which is both an advocacy body and a credentialing agency.
Andrew Wilkinson
Now you’ve just come back from a — not a tour of India but tell us about the Mumbai events.
Tyler Wood
Yeah, so I’ve been with the firm for about 10 years, and we’ve had a huge international expansion since the great financial crisis, meaning that in our advocacy efforts, working with foreign national regulators and exchanges on sort of what their credibility standards and competency standards and frameworks are for traders and portfolio managers. We’ve had a lot of demand for responsible technical analysis education. So that’s happened in Malaysia and all across Europe and emerging markets as well as in India. I’ve been very bullish on India personally for about 20 years. I actually ended up marrying a beautiful Bengali woman that I met in college here in the states. But we opened our first office in India in 2018 as the first CMT office outside of the US and it was because of the demand of our members across India. So, one month ago we went back to an in-person 3-dimensional conference. We host a lot of seminars, workshops and large-scale conferences around the world and throughout the year. That one in India was particularly enjoyable, we had a great cadre of speakers from all over the world, Australia and Japan and the US and Europe as well. They came to join us for the week and beyond just the conference, which was on Saturday, we did a ton of outreach both to our academic partner schools like KJ Somaiya gave a full day program to the Business School students there. Lots of media coverage of our visitors and then meetings with both the National Stock Exchange and the Bombay Stock Exchange that were really … it was a great exchange of information because I think a lot of our foreign delegates, didn’t know that Indian exchanges are the fastest in the world. We really — it’s hard to wrap your mind around the scale and the size of trading and just in the last couple of years they’ve moved from about 50 million market participants to 110 million market participants, which is staggering to think about how many traders are out there.
Andrew Wilkinson
And I guess the food was pretty good too.
Tyler Wood
Clearly, by the bulging — I’m testing the physical resistance of my suit buttons these days. Yes, I devour Indian food and sort of all of my colleagues — you know, to each their own, not everybody has a palate for spicy food, but I think that’s the biggest takeaway for folks outside of India is that there is no one India. If you go to an Indian food restaurant in the UK or in the US, it’s basically just North Indian food. You get some butter chicken and some naan but when you explore the country in local terms, you understand that there are 100 different countries that just happen to exist in the same border and that diversity is present in food and culture and music and dress and religion and everything else but we had a great experience.
Andrew Wilkinson
Very good, now let’s go back to pre-1973, that was kind of the launch you mentioned earlier on. Can you go back give us some context on the development of technical analysis as an industry over several 100 years? I think you have to go back to the earliest form of Futures Trading for rice contracts in Osaka, Japan and I’m not sure if it was the 1600s or the 1700s but is that a good starting point to discuss this?
Tyler Wood
That’s a great starting point and really the basis of all technical analysis. A gentleman named Munehisa Homa understood that traders in the rice pits based on their behavior, right? If it was festival season and the sun was shining and people were overly enthusiastic, they would trade up the price of rice. And if it was a doomsday scenario or people were depressed for any one reason trading would trend to the downside. So, this gentleman developed a visual tool to understand trading behavior, we call it candlestick charts, right? Everybody has them on every piece of software on the planet, so we have to thank our forefathers for coming up with these ideas of understanding Open-High-Low-Close data, understanding how trading behavior throughout the day is going to give you some insight on where price is headed, and that’s the idea behind all technical analysis is data visualization and understanding irrational human behavior.
Andrew Wilkinson
Now walk us through a little bit about the experience of somebody who’s training or going through the CMT process, what’s involved?
Tyler Wood
Well, it is a three-part exam, so we have a standardized curriculum for each of the three levels. Chartered market technicians go through a very wide course of study, so not just data visualization or securities trading, but also macroeconomics, understanding asset class correlations, understanding Dow theory, which is sort of the next leg forward in that historical progression. And then you fast forward to sort of modern-day applications. We have a ton of back testing, signal testing, quantitative methodologies for how people express technical views today. It’s very different than the pencil and paper that the founders of the CMT Association used in the late 60s, but those 3 exams are offered twice a year in June and December. Statistically, pass rates are between the mid-50s and mid- 60s percent, so most candidates will end up taking at least one level a couple of times. Don’t get discouraged, it carries that worldwide recognition of a standard of competency because the exams are difficult. We’re not trying to make this a really easy hurdle to jump over or just an online degree that you can purchase without proving your mettle.
Andrew Wilkinson
You need to be serious about doing this right?
Tyler Wood
You’ve got to be very serious.
Tyler Wood
I went through the program myself.
Andrew Wilkinson
Yeah, it’s well, a three-year commitment at least?
Tyler Wood
I personally did it in 18 months and so if you pass level 1, move on to level 2, move on to Level 3 in succession, you can take an exam every six months and you’re done in a year and a half. For a lot of folks and — we don’t have any time limit restrictions — we understand life happens. We have people in the program who’ve passed the first or second level, but then had a career shift or family formation, you name it, they can come back at any time pick up right where they left off. The caveat to that is that our curriculum is a living body of knowledge, meaning that we go out and survey the industry. We do a practice analysis. Every few years we work with psychometricians and a lot of academic statisticians to make sure that our curriculum represents what the hiring managers, Wall Street and Bay Street and Dalal Street, what they’re all looking to capture in their next new hire. So, things like risk management and quantitative systems, design and applied behavioral finance, those are additions to the curriculum that have happened just in really the last 15 years and it’s because of that refresh that we go out and find out what’s most relevant to the industry and that’s where our curriculum then becomes formed. So, we want to know what technical analysis looks like in 2023. You can pick up a textbook from the CMT curriculum.
Andrew Wilkinson
Now I want to turn to the dire performance of the stock market for 2022 and kind of get your take on how technical analysts performed this year. Where all CMT technicians united on defining that ahead of the time or at some specific point? What indicators did they use that were most reliable in predicting or viewing the bear market and which indicators confirmed its presence and duration?
Tyler Wood
Great, great questions Andrew. The first thing that I have to say is that not all market participants are ever going to agree because it depends on their risk tolerance, their objectives for the fund and their timeframes but also, math is just math. So, when you ask about what were the indicators that defined the entrance into the bear market and the sustainability to this downtrend, at the risk of sounding like an ass, price! Price is a great indicator of things going south, right? Now, if we’re talking about what is great news fodder or fodder for the news desks, they’re very concerned about that move from a correction to a bear market and the percentage terms off the highs that define that. For technical analysts and CMT charter holders specifically, what’s more important is a composite blend of information. So, we’re looking at cross-asset relationships and how they’ve changed, not overly complicating the suite of indicators we might use, but do you see volume price, trend, volatility and momentum all signaling a confirmation to the downside? That weight of the evidence approach is really what most technicians lean on so that they don’t have one pet indicator. And I think a lot of the traders that got involved in financial markets right after the COVID collapse probably found one thing that worked for them during those 12 months, and there’s nothing wrong with that. In fact, that’s how most indicators work, is that there is a period in which they’re very well situated for that market regime. But regimes change and you see quant funds blow up every four or five years because they have modeled things based on a specific regime, or they have not been able to include enough data into their back tests so that they can be agile, and I think that’s it’s a wonderful debate that will probably rage on for decades about whether you want to be purely systematic or you want to have some discretion.
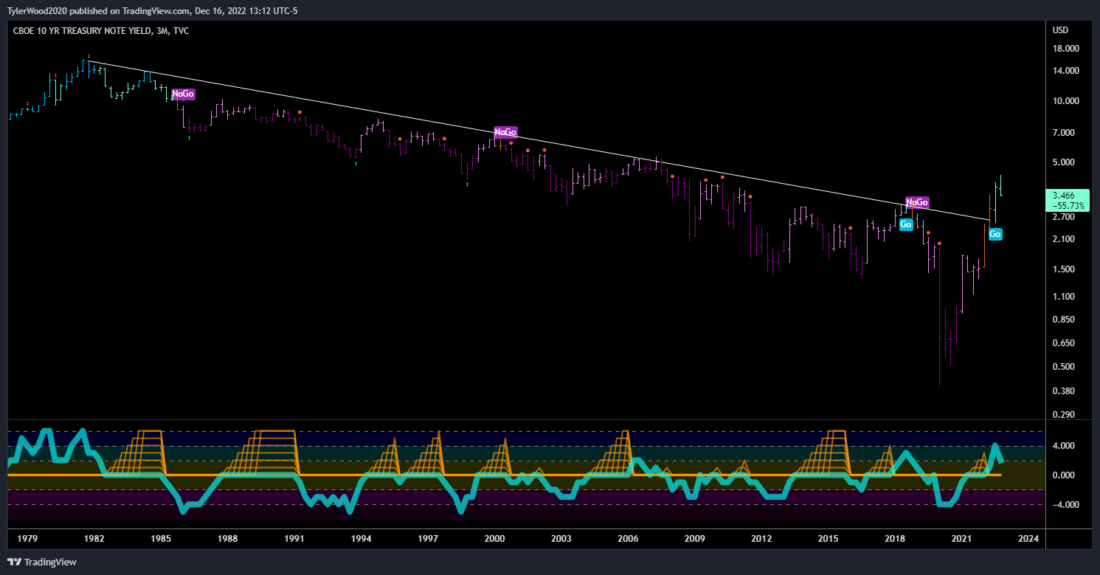
But to answer your question, did all technical analysts see the bear market at the same time? Anecdotally, we held a conference in April in Washington DC. April of 2022, it was very clear to everyone in our community that the liquidity regime had changed, that we had broken out of a 40-year downtrend on the TNX so the rising rate environment — This was not a fleeting glimpse at some inflation, it was not going to be transitory. We had secular shifts in how things were moving and then we paid very close attention to correlations between data series, and they can change over time. So historically, right, every financial advisor out there builds you a 60/40 portfolio and they tilt back and forth between bonds and equities. That’s diversification in the classic definition. This year that didn’t work for anybody, because bonds and stocks moved lower together. That’s a real problem for wealth management, when their diversification dries up, when those correlations change and that I think was the big signal to the technical community that we’re in a very different environment now than we were in 2020 and 2021.
Andrew Wilkinson
When 60/40 meets a bear market for bonds, it’s not a good thing.
Tyler Wood
It’s not a good thing and the other point, Andrew, is that in our community you can pick out sentiment signals, right? In 2020 and 2021 we saw SPACs everywhere, who didn’t have a SPAC? Did you launch a SPAC, Andrew? I bet you did. Meme stocks, right?
Andrew Wilkinson
I have a couple here in the cupboard.
Tyler Wood
Yeah, exactly. AMC at 250% gains? Like it’s a movie theater. Sure, we’ll go back to the movies after the pandemic ends, but it’s a $6 stock from any kind of fundamental valuation metric, there was no reason for this. NFTs, celebrity-endorsed cryptocurrencies, all of those are sentiment extremes and you see them appear at the top of bubbles. It’s not a sell signal, right? The market can behave irrationally much longer than you can remain solvent. So, we don’t sell based on these sentiment extremes, but technical analysis helps you take a composite view and listen to the message of the market. When things rolled over in early 2022, price is your big indicator and have we been at the party a little too long? Is the punch bowl all dried up or is it only the drunk people left? Should we call an Uber and get home? Yes, it’s time to take cover and that was I think, pretty universally experienced by members of our community.
Andrew Wilkinson
One of the signs that I remember, the signals, has to do with Dow theory. Can you just — you mentioned it earlier on — can you just spend a little time talking about Dow theory? What is it? What does it look like? Cause we don’t get bear markets very often but when did it signal something? How accurate are the signals and where are we now as we wrap up 2022?
Tyler Wood
So, I think it helps to understand who Charles H. Dow was. He’s a journalist, father of the Wall Street Journal, founder of the Dow Indices, and it was Robert Ray who wrote a book about a lot of his editorial comments in the newspaper from the turn of the century. So, it was about 1890 and Robert Ray wrote his book in the early 20th Century. What we’re talking about from Dow theory is a person who was combating as a journalist — he’s trying to understand how your average person could even participate in financial markets. At the time remember, we didn’t have the Securities Act of 1933, that we didn’t have standardized reporting of fundamental data, there was no quarterly reporting, and the insider trading was rampant. So, you’ve got no other information to go on than the market itself and so Charles H. Dow … there are several tenants. One is that markets move in multiple time frames, right? You’ll hear technical analysts talk about how markets are fractal, and that’s just a fancy word for saying you can use the same tools whether you’re looking at a daily chart, a monthly chart or a 5-minute chart. Your time frame, you can be agnostic, you can use this across the asset class.
The other thing that comes out of the Dow Theory is the need for confirmation, so think about the underlying rationale on an economic principle. If you have an industrials index, and you have a transports index, if the industrial companies are manufacturing lots of goods and the economy looks like it’s raging, but those goods are not being shipped to customers, right? The transports are not confirming a new high in the industrials, or vice versa, you know that there’s something suspect, right? Maybe all this inventory is being declared as sold but never shipped. There are lots of funny games that happen in companies, talk to some of the execs from Enron. The point of Dow Theory in 2022 is that all of those same principles because they are first principles of the market, meaning they’re sort of invaluable human behavior sort of rules, you can still use them. So, we didn’t have a confirmation from the transports in in January of 2022 so, the Dow Industrials made their penultimate high, and you didn’t get confirmation. Then they were both in sync to the downside by April, so you had confirmation of a bearish trend based on the Dow Theory tenets. But then two weeks ago, the industrials actually broke above their August high, right? We’ve seen the Dow really strengthen. Certainly, if you compare between the major US indices, Dow is outperforming the NASDAQ handily because you’re seeing a rotation into more industrial and cyclical sectors of the market. You’re not seeing the same performance from Tech which dominates the NASDAQ. But that new high in the Dow was not confirmed yet by transports, so we’re at a really interesting inflection point I think, here as we’re recording in mid-December, but releasing this in early January. Nobody knows what the future holds, but if we can listen to the message of the market and react responsibly to what that price data, what those indicators are telling us about the health and sustainability of what has basically just been a relief rally up until this point that will help investors allocate accordingly going into the new year.
Andrew Wilkinson
Very good. So, from time to time, the media likes to pick up on some signals or big bazookas as I call them that technicians pull out of their hats. Talk to me about things like the Hindenburg signal and Super Bowl signals, maybe it’s time for some myth-busting here.
Tyler Wood
I’m so glad you asked. Technicians all get walked out onto the news desks during bear markets, right? In a bull market, everybody’s a genius Andrew, because everything went up. It’s only when … what do they say? As the tide washes out, you find out who’s been swimming naked, right? And those catchy names, right? Those make for good news headlines, the Hindenburg Omen. The myth bust is that a lot of those signal tests and back tests using those signals lack robustness and so what I mean is that quantifying whatever tools you’re using by looking at a 30,60, 90-day return after a trading signal, that’s basically table stakes these days. That’s not new and that’s a basic requirement of doing anything successfully over time. You have to understand the robustness and the signal strength of the tools that you’re using across multiple regimes. So, the signals that have those big names, I really don’t — they don’t carry much water, they have not proven themselves. What has proven itself and what most money managers and strategy developers are doing is to start with a philosophical approach, right? Are you a trend follower? Do you buy things that have already been on a run? If you buy things that are expensive and sell them when they become more expensive? Or are you a “value investor” right? In the fundamental terms of value investor or a growth investor, value investors in the technical terminology is somebody who’s looking for mean reversion. You are drawn to the idea of buying things that have gone through a significant drawdown and you expect them to revert back to their longer-term average.
So mean reversion strategies, maybe a little shorter term, and if you can identify in your own personality whether or not you can tolerate shorter-term day trading scalping, swing trading, or if you’re a long-term investor, maybe something like a tactical asset allocation model is more your speed, and neither one is wrong. Neither one is better than the other. They’re just going to fit your personality and the philosophy with which you approach the markets. For a lot of people trend following is just too hard to swallow. I know when we go into a department store, we don’t immediately ask the sales associate “Hey, what’s been marked up 30%? I want to buy a coat that’s more expensive today than it was last month.” Nobody does that, and it’s really hard to wrap your mind around doing that as an investor. So, I think that’s the place to start. Not with a Hindenburg Omen. Not with a dead cat bounce or looking at those things, but then to build a set of tools that gives you that weight of the evidence approach. The probabilistic credence that you have, the conviction that you have in your trading system is going to be supported by having multiple tools that confirm or tell you the same thing at the same time. And when you can get that broad based picture using a composite blend of technical tools, then you can have faith in your system and just follow the rules, which is probably the hardest part of trading and investing is getting your own behavior and your emotions out of the way of just following the rules. Just listening to what the market’s telling you.
Andrew Wilkinson
Do you have a favorite zany indicator that people have come to you over the years with? I think my favorite was that puking donkey.
Tyler Wood
Yes, you know in fact, even in 2022, when the whole world has seemed to get beyond these ideas of market efficiency and random walk theory, there’s a reporter at the Financial Times in the UK, and I won’t call people out, but clearly some fairly narrow-minded myopic views of technical analysis. And yes, the puking donkey indicator is — everybody can have a good laugh but you know people used to laugh at the Cubs until they won the World Series. People laughed at all Boston sports teams for decades, right? The fact is, when you meet people who do this with a responsible ethical approach like CMT charter holders do, you’re going to find that the definition of technical analysis that some financial journalists are going to be using just really doesn’t square with what these people actually do every day. They’re economists, and they’re securities traders and they’re statisticians, and I think it’s a far cry away from the subjective nature of some of the pattern recognition that gets pointed to.
Andrew Wilkinson
Let’s move from equities to other asset classes. Forex for example, tends to trend quite nicely. Were there any notable — I mean 2022 was notable for the uptrend in the dollar.
Tyler Wood
The year of the dollar.
Andrew Wilkinson
Were there any late on or notable signals during 2022 for Forex and how about bonds? With the Fed in the crosshairs lifting interest rates at the fastest pace in or probably ever, how did technicians fare with fixed-income assets this year?
Tyler Wood
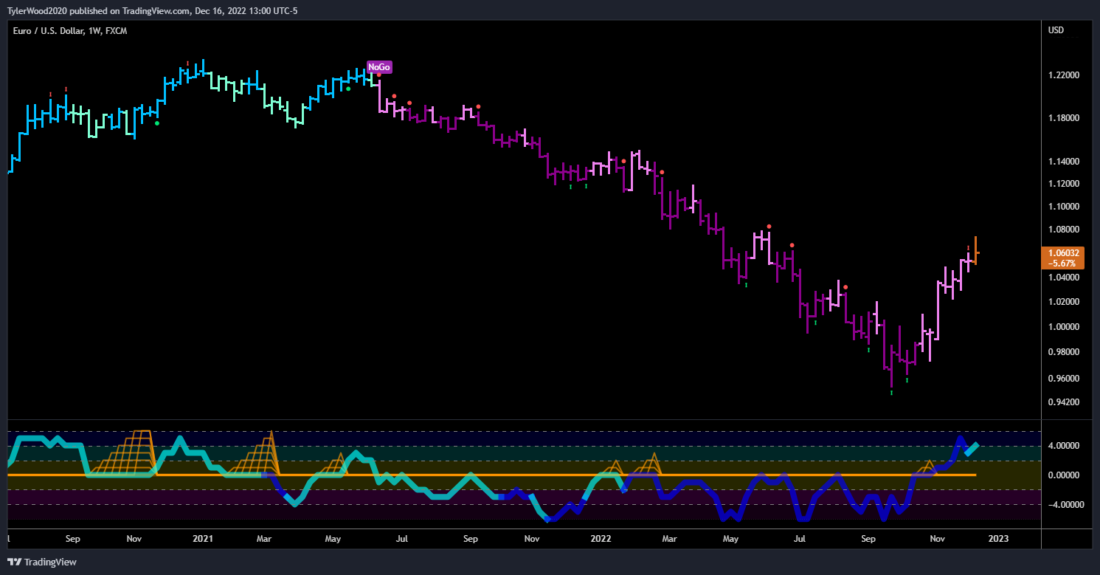
So, I’ll answer that in two parts, one that trade in the US dollar really confounded all of Wall Street. I mean, how many analysts were calling for the top in the dollar in April and May and June and then again in July and August and September. The fact is, if you’re just following trend, if you’re using the core of all of our signals right, which is what is price doing? Then you saw that the US dollar had this run that was basically uninterrupted right? There were periods of consolidation contraction, but never, never an anti-trend movement and that’s really a product of the US responding earlier to inflation than most of the other central bankers, which made US dollar sort of a safe haven trade. It’s also caused lots of headwinds for emerging markets and equities broadly, risk assets broadly, but the reversion in the last few weeks … what’s notable is both the UK and eurozone right? Euro/Dollar US has been a fantastic sort of view on maybe where we’re seeing things change, right? If inflation is tapering off, not over, but tapering off.
Andrew Wilkinson
Stop ramping up as fast as possible.
Tyler Wood
Correct, but also emerging markets, right? We’ve seen relative performance in China, in Hong Kong over US equities indices, but a lot of that can be captured in the in the currency trade as well. Taking it back to our experience in India just last month, I think what’s really attractive to a lot of global macro investors is where you can get a double whammy. So, when you’re looking at an equities market that’s basically been flat on the year 2022 where all other markets have had significant drawdowns. So, India has outperformed on a relative basis, and now you might actually get that double whammy of the currency trade. That’s very favorable to an international allocator and then you asked about the bond market, there’s a lot of information in the bond market. Even if folks are not trading bonds, I highly recommend that you pay attention, at least to what’s going on in the in the rate environment and yields. But then what I would say is that if you’re the poor chap who has to be a bond trader, there are some technical concepts that can really improve your return. So even in a struggling asset class, if you look at relative strength right, compare your durations short versus long or quality, right? HG versus LQD. Are you looking at high yield? Are you looking at corporate-grade debt? Are you looking at government treasuries? A lot of technical tools can help you in a comparative sense to understand where the relative outperformance is. So, for sector analysts out there as well who are listening, if you happen to be forced into a TMT or communications sector analyst role and maybe most of your work is fundamental, do a momentum screen. Do a technical screen to pull out those opportunities that at least the market agrees with your fundamental thesis, and I think that can really lead to outperforming peers even in a struggling asset class or sector group, you name it.
Andrew Wilkinson
So, let’s finish on an outlook for 2023. As you’re getting ready to write for next year, what’s on the radar? What are you looking at? Pick your markets for us.
Tyler Wood
I’ve got to say first, that the whole idea of technical analysis and trend-following investors is that we don’t forecast. We want to obey what the market is telling us, but to be a good steward on this podcast–
Andrew Wilkinson
You won’t get paid if you don’t.
Tyler Wood
That’s right, that’s right. If you look at longer-term charts, that’s going to tell you longer-term trend potential, right? So, we’re not talking about what’s happened in the last 30 minutes or the last even 15 weeks. If we’re looking at monthly and quarterly charts, I would say that the commodities space is still very favorable. And what I mean, you know energy was everybody’s favorite trade. In 2022, the first half of the year was energy versus everything else, and then people found out about it, and then it became uncool. It’s like cocktail bars in Manhattan. You know, they’re wonderful until somebody writes it up in the New York Times and then then you can’t even find a seat.
Andrew Wilkinson
That really kills it.
Tyler Wood
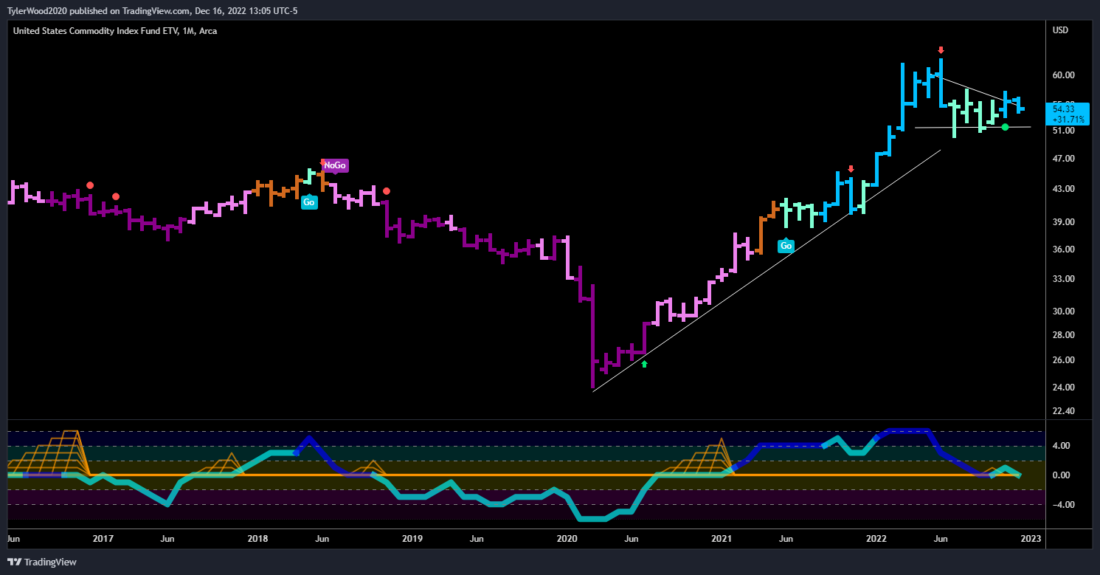
What I would look at it, a longer-term chart of like the US Commodities Index, is the idea that we had a breakout from a very long-term secular downtrend and that was sizable enough to suggest the start of a new secular trend so we’re talking about long term periods of years. But then we’ve had this consolidation, right? We haven’t completely fallen out of bed, we’ve moved sideways. If you’re looking at monthly bars or even quarterly, we’ve had this sideways consolidation, which kind of looks like a trend continuation pattern. If you think about the behavior of investors, there was a run up in commodities and then it sort of stagnated, you know, the purpose of rate of change but that typically leads to a continuation to the upside. I think the commentary from Fed chairman Jerome Powell that we’re still going to be combating inflation, we’re not worried about recession, we’re seeing strong jobs numbers. I think we are going to see that commodities play out over the next several years. So not a short-term trade, but a longer-term asset allocation perspective and that’s across the board.
The energy complex is really fascinating, both on the renewable side and traditional energy. And then maybe even precious metals as the dollar starts to tear off. And within the equity space, I think anybody who’s not positioned defensively going into 2023 is seeing something that I’m just not seeing. So things like healthcare and Staples have shown outperformance really steadily throughout the year, but then increasingly here in the last few weeks and as well as cyclicals right materials and industrials have held their own. I think what will be the tell in 2023 in terms of Index level performance is whether energy and financials can get back into an upward trend, and that’ll be a signal for whether or not the broad market averages move up. I would definitely steer people away from everything that was so attractive in in the run up in 2020 and 2021, right? Netflix is nobody’s friend right now. Semiconductors, interestingly, seem to be showing some opportunity, but that might be more of a short-term trade. I certainly see a lot of those communications companies that we all relied so heavily on during the stay-at-home trade; they may be washed out for a while.
Andrew Wilkinson
Do you have any thoughts on the duration of the bear market … it’s I mean all of this year, right? Does that bring us to a point — Is there a tipping point where we like? It’s been long enough, bear markets only last X months historically, any thoughts on that?
Tyler Wood
A lot of folks smarter than I study cycles, and I think there’s a lot of a lot of great work out there that we could encourage listeners to go to go read. What I would say that’s less important than the time frame is more a factor of market internals, so when we talk about market breadth, right. There are a series of indicators that are really important to be watching at market tops. A different series of indicators that are really important to be watching for trend continuation and what my friend Jason Peretz always says. is “Stocks have to stop going down before they can go back up.” So, if we look at broad measures of breadth like the advanced decline line, we start to see these breadth thrusts off the lows where more and more market participants, more and more stocks within the index are above a 10 day moving average, 20 period moving average, 50 period moving average and as you get into longer durations then then you can understand that the rally is sustainable but first you have to see broad participation. And the opposite exists at tops, so in the fall of 2021 we got very narrow, right? The US indices were making new highs, but on the backs of you know, eight or nine stocks. That’s an interesting anecdote as well, right? That we had 100 million Americans sent home from work and given a stimulus check and what did they do? They became traders. They opened a Robinhood account and or excuse me, we’re going to edit that out, they opened an Interactive Brokers account and they —
Andrew Wilkinson
Actually, I like it first. You should probably stick with the Robinhood thing and they opened Robinhood accounts and they all got screwed.
Tyler Wood
Yeah, they own a Robinhood account, and they got screwed. Then they found their way to Interactive Brokers, they listen to this podcast now they know how to use technical analysis and the rest is history. My point being that market breadth really dried up to very few names, because those were the those were the mega cap names of the day, right? IBM in the 80s is now the Facebook, Meta, Amazon, Netflix, Google, trade of 2022. What’s really interesting about the topping pattern is that when you get a really narrow market and the cap weighting within the S&P 500 — is a cap weighted index — those nine names can carry the entire index even while there is absolute churn and destruction going on for most of the names below those, those top 10 holdings. So, we’re looking at the reverse in in terms of breadth thrusts to get out of bear market territory.
Andrew Wilkinson
What’s on the horizon for the CMT this year? Do you have — you mentioned the April 2022 meeting in New York or Washington? Is that repeated this year?
Tyler Wood
Oh my gosh, we have got a very full agenda for 2023. So, in celebration of 50 years, we’re pulling out all of the stops we will be hosting a global investment conference in New York City. It’s called our CMT symposium, that’s April 26th, 27th and 28th in Midtown Manhattan. We’ll also be down at the New York Stock Exchange, Thursday night celebration with a number of notable guests. Full information about that conference is available at our website, but more importantly, what we’re really excited about is just the all-time highs that we’ve seen in terms of CMT enrollment. There are now over 10,000 candidates in the program learning these tools, studying and hopefully passing their exams. As we sit here recording, we just concluded the December testing cycle. Really proud of all of the folks from 137 countries around the world who put forth their best effort on the CMT programs this last week, and we’ll be launching the new curriculum for 2023 in January as we open registration for those June exams. June 1 through 12 will be the next CMT exam window and so yes, we are very bullish on the growth of the organization on the status of our members around the world and the growth of CMT charter holders on the largest buy side firms on the planet.
Andrew Wilkinson
Very good. Tyler Wood, thank you ever so much for joining me today to wrap up 2022. We appreciate your insight into the topic and good luck with next year.
Tyler Wood
Thank you so much for having me Andrew, looking forward to the next time.
Andrew Wilkinson
Brilliant. Thanks very much, Tyler.
—
$TNX qrtly – 40 year downtrend in US Rates – BROKEN in 2022 – https://www.tradingview.com/x/uUVd5ymf/
EUR/USD Weekly – https://www.tradingview.com/x/uJLjB1Sd/
US Commodity Index $USCI Monthly – https://www.tradingview.com/x/BOlEtLw2/
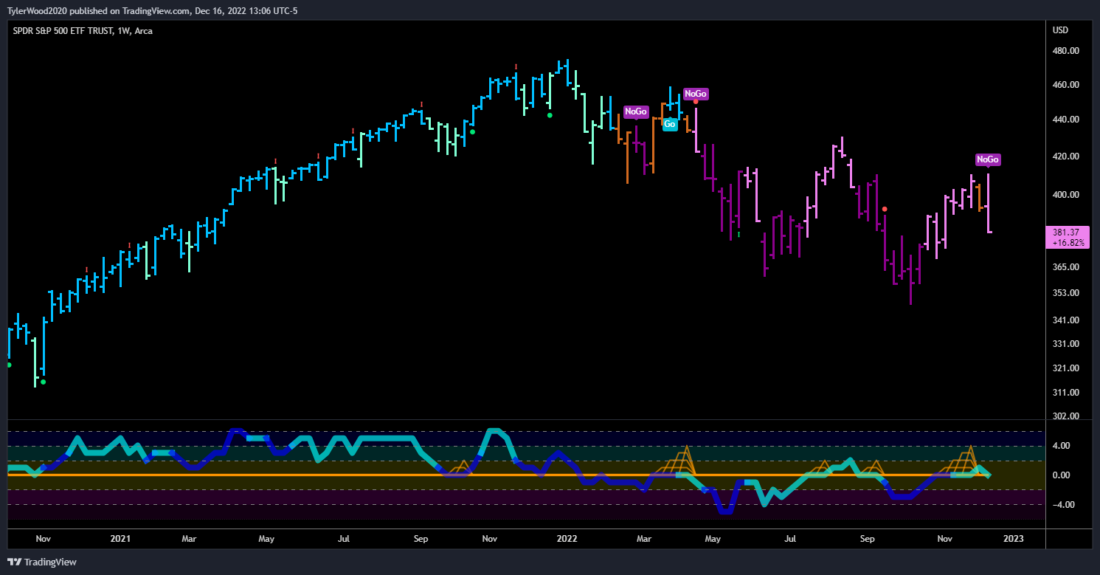
S&P 500 weekly “clean clear and orderly bear market” series of lower highs and lower lows in 2022 – https://www.tradingview.com/x/ESMUDugf/
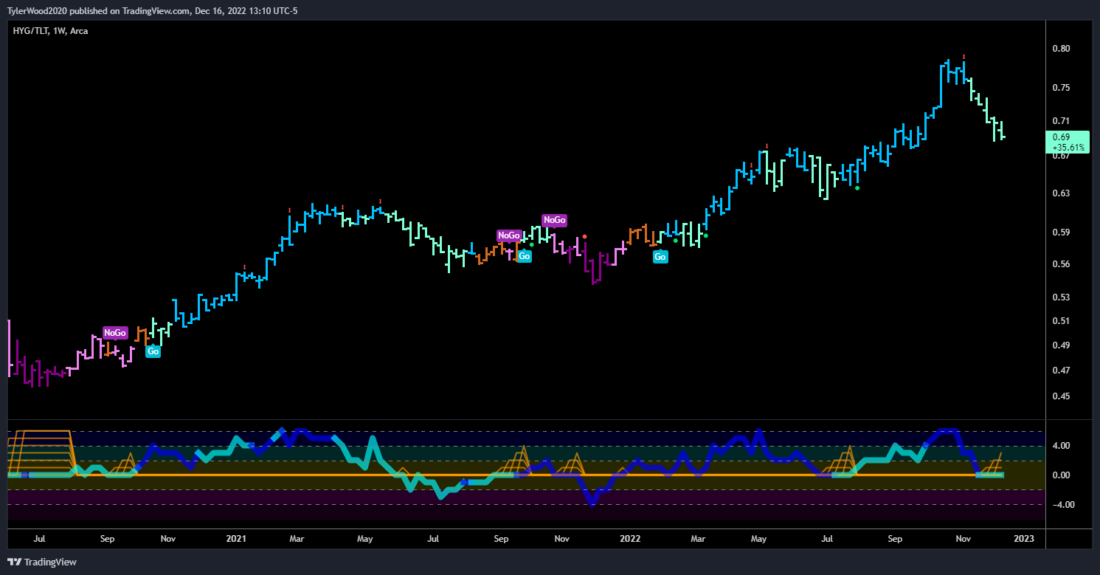
HYG/TLT Weekly (Junk Bond vs US Treasury ratio as risk proxy – q4 2021): https://www.tradingview.com/x/pptIoSAH/
GoNoGo Sector HeatMap – Relative Strength of each sector against benchmark (Weekly trends) – https://www.tradingview.com/x/7I0dhII0/
Disclosure: Interactive Brokers
The analysis in this material is provided for information only and is not and should not be construed as an offer to sell or the solicitation of an offer to buy any security. To the extent that this material discusses general market activity, industry or sector trends or other broad-based economic or political conditions, it should not be construed as research or investment advice. To the extent that it includes references to specific securities, commodities, currencies, or other instruments, those references do not constitute a recommendation by IBKR to buy, sell or hold such investments. This material does not and is not intended to take into account the particular financial conditions, investment objectives or requirements of individual customers. Before acting on this material, you should consider whether it is suitable for your particular circumstances and, as necessary, seek professional advice.
The views and opinions expressed herein are those of the author and do not necessarily reflect the views of Interactive Brokers, its affiliates, or its employees.
Disclosure: ETFs
Any discussion or mention of an ETF is not to be construed as recommendation, promotion or solicitation. All investors should review and consider associated investment risks, charges and expenses of the investment company or fund prior to investing. Before acting on this material, you should consider whether it is suitable for your particular circumstances and, as necessary, seek professional advice.
Disclosure: Forex
There is a substantial risk of loss in foreign exchange trading. The settlement date of foreign exchange trades can vary due to time zone differences and bank holidays. When trading across foreign exchange markets, this may necessitate borrowing funds to settle foreign exchange trades. The interest rate on borrowed funds must be considered when computing the cost of trades across multiple markets.
Disclosure: Bitcoin Futures
TRADING IN BITCOIN FUTURES IS ESPECIALLY RISKY AND IS ONLY FOR CLIENTS WITH A HIGH RISK TOLERANCE AND THE FINANCIAL ABILITY TO SUSTAIN LOSSES. More information about the risk of trading Bitcoin products can be found on the IBKR website. If you're new to bitcoin, or futures in general, see Introduction to Bitcoin Futures.
Disclosure: Futures Trading
Futures are not suitable for all investors. The amount you may lose may be greater than your initial investment. Before trading futures, please read the CFTC Risk Disclosure. A copy and additional information are available at ibkr.com.
Join The Conversation
If you have a general question, it may already be covered in our FAQs. If you have an account-specific question or concern, please reach out to Client Services.