


The Volume Profile Indicator
Investopedia is partnering with CMT Association on this newsletter. The contents of this newsletter are for informational and educational purposes only, however, and do not constitute investing advice. The guest authors, which may sell research to investors, and may trade or hold positions in securities mentioned herein do not represent the views of CMT Association or Investopedia. Please consult a financial advisor for investment recommendations and services.
The Volume Profile Indicator
When a technical analyst evaluates a price chart, he or she will identify horizontal levels of supply (resistance) and demand (support). These levels will help the analyst determine trend, manage risk, and develop a complete view of the asset. One way to confirm if a price level is important and holds price memory, is to apply the volume profile indicator (VPI). Unlike traditional volume, which provides a temporal view of the asset’s relationship with volume, VPI ignores timeframe and reviews volume at specific price levels. In other words, instead of identifying the total volume of stock XYZ on this specific day, week or month, VPI tells us at what price the volume occurred. For this reason, VPI is presented as a horizontal histogram. The thought is that if a large number of shares are exchanging hands at a certain level, it is more likely this level holds true price memory and will behave as support/resistance.
The VPI level with the highest volume is referred to as the point of control (POC). The POC can be used to help confirm support/resistance levels. For example, the below chart highlights a liquid market index fund with a volume profile running from the October ’22 low to the Summer ’23 high. The POC confirmed the support/resistance zone ~$410 per share. Months later the asset successfully tested this support zone and witnessed demand bid prices higher.
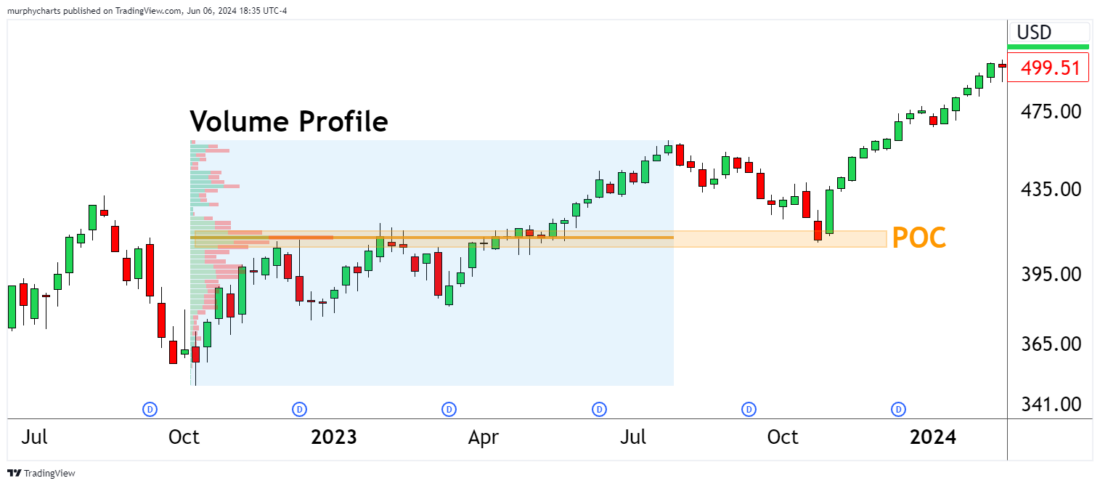
VPI not only helps us identify support/resistance zones, but it can also aid our understanding of trend. When the POC is near the lower end of the profile amid what appears to be a healthy uptrend, we should reevaluate and ask ourselves why is volume declining at higher price levels? The below is a great example of an asset appearing to be in a strong uptrend, but the volume profile is not confirming the move higher. Eventually, price finds its way back to the POC and retests this level several times before breaking down.

The volume profile indicator provides a unique way to analyze supply and demand. Its application can vary depending on the asset or the analyst, but it remains an important tool in the technical analyst’s toolkit.
About This Week’s Author
Shane Murphy, CMT has been a CMT Charterholder since 2022. He is currently a Wealth Management Associate at Michael Roberts Associates, Inc. where he assists in portfolio construction, investment research, and financial planning.
——–
Originally posted on June 7th, 2024
Disclosure: Investopedia
Investopedia.com: The comments, opinions and analyses expressed herein are for informational purposes only and should not be considered individual investment advice or recommendations to invest in any security or to adopt any investment strategy. While we believe the information provided herein is reliable, we do not warrant its accuracy or completeness. The views and strategies described on our content may not be suitable for all investors. Because market and economic conditions are subject to rapid change, all comments, opinions and analyses contained within our content are rendered as of the date of the posting and may change without notice. The material is not intended as a complete analysis of every material fact regarding any country, region, market, industry, investment or strategy. This information is intended for US residents only.
Disclosure: Interactive Brokers
Information posted on IBKR Campus that is provided by third-parties does NOT constitute a recommendation that you should contract for the services of that third party. Third-party participants who contribute to IBKR Campus are independent of Interactive Brokers and Interactive Brokers does not make any representations or warranties concerning the services offered, their past or future performance, or the accuracy of the information provided by the third party. Past performance is no guarantee of future results.
This material is from Investopedia and is being posted with its permission. The views expressed in this material are solely those of the author and/or Investopedia and Interactive Brokers is not endorsing or recommending any investment or trading discussed in the material. This material is not and should not be construed as an offer to buy or sell any security. It should not be construed as research or investment advice or a recommendation to buy, sell or hold any security or commodity. This material does not and is not intended to take into account the particular financial conditions, investment objectives or requirements of individual customers. Before acting on this material, you should consider whether it is suitable for your particular circumstances and, as necessary, seek professional advice.


Join The Conversation
If you have a general question, it may already be covered in our FAQs. If you have an account-specific question or concern, please reach out to Client Services.