


- The STI booked a 7% total return in Nov, with Singapore’s 100 most traded stocks in the 2022 YTD paralleling the monthly return. The Consumer Cyclical Sector led the most traded stocks over the month with Genting Sing, Jardine C&C, NIO Inc, The Hour Glass, Parkson Retail and mm2 Asia averaging 15% total returns.
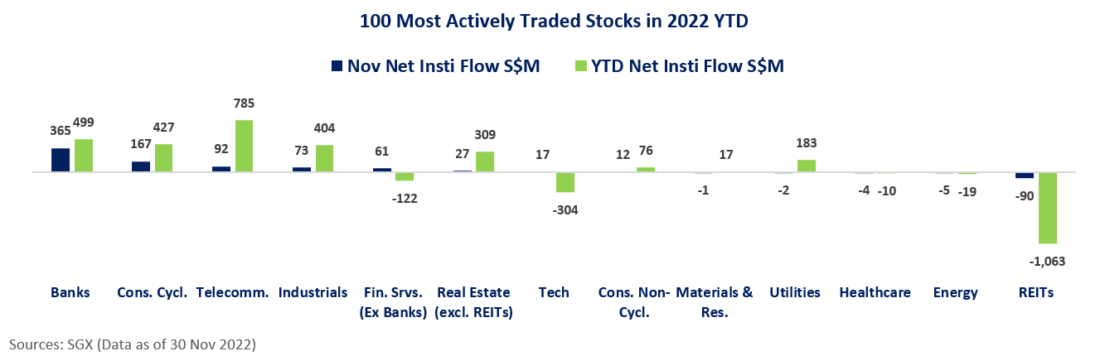
- Singapore’s 100 most actively traded stocks booked S$712 million of net fund inflow in November, with Banks, Consumer Cyclicals and the Telecommunication Sectors leading the net fund inflow, while the REIT, Energy and Healthcare Sectors booked the most net fund outflows.
- The region benefited from a 5% decline of the US Dollar Index over the month, in addition to growing expectations Asia will be the main engine of global growth in 2023 and 2024, and key China policy moves such as optimised Covid rules, fiscal support to small businesses and supportive property market policies.
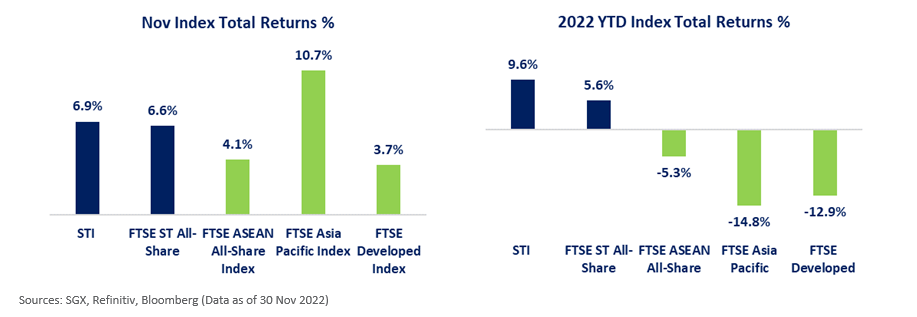
In November the STI added 6.4%, with dividends boosting the total return to 6.9%. This was the strongest price performance for the STI since March 2021, with the broader FTSE Asia Pacific Index generating one of its strongest monthly gains on records. As illustrated below, the FTSE Asia Pacific Index 10.7% total return (in SGD terms) for November, pared the decline of the benchmark over the past 11 months to 14.8%.
The 100 most traded Singapore stocks this year include the 30 STI constituents, and have comprised 95% of the turnover of the Singapore stock market over the past 11 months. The 100 stocks averaged a 6.6% total return for the month, with the median total return at 5.7%. The 100 stocks also booked S$712 million of net fund inflow in November, bringing the net fund inflow for the 100 stocks over the past 11 months to S$1.18 billion. Unite d Overseas Bank, Jardine Cycle & Carriage, Singapore Telecommunications, CapitaLand Investment and Genting Singapore led the net fund inflow of the 100 stocks over the month. On the 30 Nov session, Jardine Cycle & Carriage traded 25x its usual trading turnover with S$119 million of net fund inflow with the stock added to the MSCI Singapore Free Index on the close.
As illustrated below, among the 100 stocks, Banks, Consumer Cyclicals and the Telecommunications Sectors led the net fund inflow in November, with the three Sectors albeit in order of Telecommunications, Banks and Consumer Cyclicals also leading the net fund inflow for the past 11 months.
In Singapore, Singapore Telecommunications has booked the most net fund inflow over the past 11 months, with S$924 million of net fund inflow, and follows on from DBS Group Holdings booking the most net institutional inflow in 2021.
For November, the REIT Sector led the net fund outflows, with the Sector also leading the net fund outflows over the past 11 months.
The outlook for Asia Growth, US interest rates were key market drivers throughout November.
- On the growth front, the OECD predicted global GDP growth would slide from 3.1% in 2022, to 2.2% in 2023, while it maintained Asia will be the ‘main engine of growth’ in 2023 and 2024, whereas Europe, North America and South America are expected to see ‘very low growth’. The outlook for China growth was particularly helped in November, with policy moves that included optimised COVID rules to bolster the economy, fiscal support to small businesses, supportive monetary policy, in addition to reports of a series of supportive property market policies that include 16 measures co-released by the PBOC and the CBIRC.
- For US interest rates, much focus has remained on the 14 Dec FOMC, with marginally more dovish expectations of a 50bps, rather than a 75bps hike building over the month. Meanwhile, the outlook for 2023 interest rates remains highly fluid, and over the month 2023 US interest rate expectations become marginally more hawkish, with most expectations now seeing the peak rate at 5.00-5.25%, taking effect in March, and carrying through until the 1 Nov 2023 FOMC. This saw the US Dollar Index decline 5% for the month, while longer term 10-year UST yields eased from 4.05% to 3.60% over the month.
Meanwhile, three key downside risks to look out for in 2023, relayed by MTI last week, include:
- The impact of the ‘simultaneous’ raising of interest rates to curb inflation producing a larger than expected impact on advanced economy growth;
- The potential for financial stability risks intensifying if there are disorderly market adjustments to the raising interest rates; and
- The escalation of the war in Ukraine and other geopolitical tensions impacting supply chains, business, and consumer confidence.
For the 100 most traded Singapore stocks, the Consumer Cyclicals and Technology Sectors led the November gains. On the Consumer Cyclical side, Genting Singapore, Jardine Cycle & Carriage, NIO Inc, The Hour Glass, Parkson Retail (note on the SGX Watchlist) and mm2 Asia averaged 15% total returns. Average total returns for the relevant Technology stocks closely followed with AEM Holdings, UMS Holdings, Frencken Group, Nanofilm Technologies International, iFAST Corporation, Aztech Gbl, ISDN Holdings, and Silverlake Axis averaging 14% total returns over the month.
Singapore’s 100 most traded stocks over the past 11 months are tabled below.
| Stock | Code | Mkt Cap S$M | YTD Avg. Daily T/O S$M | YTD Net Insti Flow S$M | YTD Total Ret. % | Sector | Nov Total Ret. % | Nov Net Insti Flow S$M |
| DBS | D05 | 90,567 | 148.0 | -21 | 12 | Banks | 4 | 10.9 |
| UOB | U11 | 52,248 | 91.5 | -31 | 21 | Banks | 12 | 306.4 |
| OCBC Bank | O39 | 55,914 | 79.5 | 551 | 14 | Banks | 3 | 48.0 |
| Singtel | Z74 | 44,891 | 78.0 | 924 | 23 | Telecommunications | 12 | 105.7 |
| CapLand IntCom T | C38U | 13,735 | 48.8 | 114 | 4 | REITs | 10 | 4.4 |
| CapLand Ascendas REIT | A17U | 11,721 | 33.1 | -109 | 0 | REITs | 6 | -29.6 |
| YZJ Shipbldg SGD | BS6 | 5,649 | 33.0 | 111 | 118 | Industrials | 19 | 60.9 |
| CapitaLandInvest | 9CI | 18,769 | 31.6 | 119 | 12 | Fin. Services (Ex Banks) | 22 | 77.4 |
| Wilmar Intl | F34 | 25,590 | 29.8 | 64 | 3 | Consumer Non-Cycl. | 6 | -13.4 |
| Mapletree PanAsia Com Tr | N2IU | 8,954 | 27.5 | -130 | -10 | REITs | 9 | 4.1 |
| SIA | C6L | 16,338 | 26.8 | 63 | 10 | Industrials | 5 | 16.3 |
| Keppel Corp | BN4 | 13,210 | 26.7 | 392 | 55 | Industrials | 8 | 30.2 |
| JMH USD | J36 | 19,033 | 25.3 | -37 | -7 | Industrials | 2 | 4.0 |
| Mapletree Log Tr | M44U | 7,743 | 25.3 | -83 | -11 | REITs | 7 | -16.8 |
| SGX | S68 | 9,675 | 24.0 | 9 | 1 | Fin. Services (Ex Banks) | 8 | 2.2 |
| ST Engineering | S63 | 10,677 | 20.9 | -109 | -5 | Industrials | 4 | -17.7 |
| Suntec Reit | T82U | 3,998 | 18.4 | -12 | -2 | REITs | 10 | 0.2 |
| Mapletree Ind Tr | ME8U | 6,030 | 16.7 | -183 | -13 | REITs | 3 | -10.6 |
| Genting Sing | G13 | 10,623 | 16.3 | 171 | 16 | Consumer Cycl. | 9 | 61.0 |
| HongkongLand USD | H78 | 12,720 | 16.2 | -6 | -18 | Real Estate (excl. REITs) | 1 | -15.6 |
| Venture | V03 | 5,035 | 15.8 | -58 | -1 | Technology | 9 | 14.0 |
| Jardine C&C | C07 | 11,940 | 15.3 | 241 | 53 | Consumer Cycl. | 2 | 108.3 |
| CityDev | C09 | 7,518 | 14.8 | 304 | 28 | Real Estate (excl. REITs) | 9 | 4.4 |
| Sembcorp Marine | S51 | 4,332 | 14.8 | 210 | 68 | Industrials | 9 | 54.2 |
| YZJ Fin Hldg | YF8 | 1,273 | 14.3 | -241 | N/A | Fin. Services (Ex Banks) | 11 | -15.6 |
| ComfortDelGro | C52 | 2,664 | 14.3 | -125 | -8 | Industrials | -3 | -49.4 |
| Sembcorp Ind | U96 | 5,691 | 13.8 | 189 | 64 | Utilities | 10 | -1.7 |
| ThaiBev | Y92 | 15,952 | 13.8 | -56 | -1 | Consumer Non-Cycl. | 10 | 9.8 |
| Frasers L&C Tr | BUOU | 4,214 | 13.4 | -64 | -20 | REITs | 7 | 1.4 |
| SATS | S58 | 3,002 | 13.1 | -151 | -31 | Industrials | -2 | -23.3 |
| Keppel DC Reit | AJBU | 3,180 | 11.2 | -135 | -22 | REITs | 5 | 5.8 |
| Keppel Reit | K71U | 3,368 | 10.4 | -59 | -16 | REITs | 1 | -29.7 |
| AEM SGD | AWX | 1,152 | 9.0 | -29 | -27 | Technology | 16 | -2.2 |
| UOL | U14 | 5,625 | 8.6 | -11 | -4 | Real Estate (excl. REITs) | 8 | -5.8 |
| Frasers Cpt Tr | J69U | 3,459 | 7.5 | -46 | -7 | REITs | 0 | -14.1 |
| CapLand Ascott T | HMN | 3,256 | 7.3 | 6 | -4 | REITs | -1 | -7.0 |
| UMS | 558 | 823 | 7.2 | -17 | -16 | Technology | 37 | 8.4 |
| NetLink NBN Tr | CJLU | 3,351 | 6.8 | -114 | -9 | Telecommunications | 4 | -11.9 |
| Golden Agri-Res | E5H | 3,678 | 6.8 | 22 | 26 | Consumer Non-Cycl. | 3 | 6.9 |
| Geo Energy Res | RE4 | 513 | 6.4 | -17 | 31 | Energy | -6 | -6.4 |
| Lendlease Reit | JYEU | 1,658 | 6.2 | -7 | -11 | REITs | 4 | -3.1 |
| First Resources | EB5 | 2,527 | 5.6 | 4 | 11 | Consumer Non-Cycl. | 8 | 2.6 |
| Rex Intl | 5WH | 300 | 5.3 | -14 | -23 | Energy | 2 | 0.4 |
| Golden Energy | AUE | 2,045 | 5.3 | 17 | 167 | Energy | -11 | 1.0 |
| Frencken | E28 | 436 | 5.2 | -49 | -47 | Technology | 21 | 7.2 |
| NIO Inc. USD OV | NIO | 22,568 | 5.0 | -24 | N/A | Consumer Cycl. | 11 | -2.6 |
| CapLand China T | AU8U | 1,891 | 4.9 | -67 | 0 | REITs | 16 | 4.0 |
| DigiCore Reit USD | DCRU | 938 | 4.7 | -14 | -45 | REITs | 18 | 0.0 |
| Nanofilm | MZH | 874 | 4.2 | -95 | -65 | Technology | -24 | -17.8 |
| ESR-LOGOS REIT | J91U | 2,318 | 4.1 | -26 | -24 | REITs | 1 | -1.3 |
| Sheng Siong | OV8 | 2,481 | 3.7 | 77 | 18 | Consumer Non-Cycl. | 6 | 9.5 |
| CapLand India T | CY6U | 1,358 | 3.2 | -37 | -12 | REITs | 4 | 1.6 |
| RH PetroGas | T13 | 151 | 3.2 | -6 | 11 | Energy | 2 | -0.3 |
| IFAST | AIY | 1,552 | 3.0 | -59 | -36 | Technology | 31 | 7.8 |
| Kep Infra Tr | A7RU | 2,696 | 2.9 | -7 | 6 | Utilities | 2 | 0.0 |
| Raffles Medical | BSL | 2,522 | 2.9 | 7 | 2 | Healthcare | 2 | 6.6 |
| CDL HTrust | J85 | 1,460 | 2.9 | 8 | 5 | REITs | 2 | 4.8 |
| Riverstone | AP4 | 934 | 2.8 | 32 | 12 | Healthcare | 20 | -0.1 |
| Olam Group | VC2 | 5,298 | 2.8 | -33 | -17 | Consumer Non-Cycl. | 3 | -1.2 |
| DFIRG USD | D01 | 4,708 | 2.7 | -9 | -6 | Consumer Non-Cycl. | 11 | 1.7 |
| ParkwayLife Reit | C2PU | 2,353 | 2.7 | -23 | -22 | REITs | -3 | -2.1 |
| Jiutian Chemical | C8R | 149 | 2.5 | 19 | 7 | Materials & Resources | -4 | -0.9 |
| Top Glove | BVA | 2,122 | 2.4 | -9 | -66 | Healthcare | 10 | 2.6 |
| Samudera Shipping | S56 | 518 | 2.4 | 25 | 110 | Industrials | 11 | 0.0 |
| SPHREIT | SK6U | 2,532 | 2.3 | -7 | -4 | REITs | 10 | 9.8 |
| HPH Trust USD | NS8U | 2,202 | 2.3 | 13 | -9 | Industrials | 10 | -2.0 |
| Emperador Inc. | EMI | 7,632 | 2.1 | -4 | N/A | Consumer Non-Cycl. | 0 | -1.6 |
| ManulifeReit USD | BTOU | 942 | 2.0 | -26 | -38 | REITs | 3 | -1.2 |
| Frasers HTrust | ACV | 857 | 1.9 | 6 | -1 | REITs | 2 | -4.0 |
| Dyna-Mac | NO4 | 191 | 1.8 | 3 | 103 | Industrials | 3 | 0.2 |
| SingPost | S08 | 1,170 | 1.8 | -8 | -18 | Industrials | -3 | 0.5 |
| AIMS APAC Reit | O5RU | 862 | 1.7 | -28 | -11 | REITs | -1 | -3.8 |
| StarHub | CC3 | 1,849 | 1.5 | -25 | -17 | Telecommunications | 0 | -1.7 |
| Sasseur Reit | CRPU | 958 | 1.4 | -38 | -1 | REITs | 10 | -0.8 |
| SIA Engineering | S59 | 2,516 | 1.4 | 12 | 3 | Industrials | 4 | -0.5 |
| The Hour Glass | AGS | 1,409 | 1.3 | 42 | 9 | Consumer Cycl. | 11 | -0.1 |
| Yanlord Land | Z25 | 1,903 | 1.3 | -15 | -6 | Real Estate (excl. REITs) | 14 | -1.8 |
| Chip Eng Seng | C29 | 580 | 1.3 | 57 | 89 | Real Estate (excl. REITs) | 3 | 44.6 |
| Hong Fok | H30 | 807 | 1.3 | 19 | 31 | Real Estate (excl. REITs) | 6 | 0.6 |
| Haw Par | H02 | 2,059 | 1.2 | -39 | -16 | Healthcare | -2 | -13.5 |
| StarhillGbl Reit | P40U | 1,191 | 1.2 | -12 | -14 | REITs | 3 | 0.0 |
| Prime US ReitUSD | OXMU | 778 | 1.1 | -24 | -35 | REITs | 0 | -2.1 |
| Far East HTrust | Q5T | 1,253 | 1.1 | 1 | 12 | REITs | 10 | 2.0 |
| Japfa | UD2 | 1,040 | 1.1 | 1 | -14 | Consumer Non-Cycl. | 0 | -0.8 |
| Aztech Gbl | 8AZ | 625 | 1.1 | -8 | 1 | Technology | 7 | 0.1 |
| Bumitama Agri | P8Z | 1,058 | 1.0 | 11 | 20 | Consumer Non-Cycl. | 3 | -1.5 |
| ISDN | I07 | 175 | 1.0 | -3 | -43 | Technology | 10 | 0.0 |
| Marco Polo Marine | 5LY | 149 | 0.9 | 3 | 56 | Industrials | 14 | -0.4 |
| Cromwell Reit EUR | CWBU | 1,228 | 0.9 | -13 | -40 | REITs | -1 | -1.9 |
| Straits Trading | S20 | 1,084 | 0.9 | -3 | -12 | Materials & Resources | 17 | -0.2 |
| KepPacOakReitUSD | CMOU | 795 | 0.9 | -17 | -23 | REITs | 0 | -0.1 |
| Wing Tai | W05 | 1,140 | 0.8 | -37 | -13 | Real Estate (excl. REITs) | 3 | 0.6 |
| Yoma Strategic | Z59 | 206 | 0.8 | -1 | -30 | Real Estate (excl. REITs) | 11 | -0.1 |
| The Place Hldg | E27 | 88 | 0.8 | -9 | -81 | Fin. Services (Ex Banks) | -48 | -2.5 |
| OUE Com Reit | TS0U | 1,995 | 0.7 | -15 | -12 | REITs | 12 | 0.9 |
| Daiwa Hse Log Tr | DHLU | 439 | 0.7 | -23 | -15 | REITs | 16 | -0.3 |
| Acesian Partners | 5FW | 21 | 0.7 | 1 | 169 | Industrials | 30 | 0.1 |
| Parkson Retail^ | O9E | 41 | 0.6 | 0 | 455 | Consumer Cycl. | 53 | 0.0 |
| Silverlake Axis | 5CP | 941 | 0.6 | 14 | 39 | Technology | 18 | -0.6 |
| MM2 Asia | 1B0 | 126 | 0.6 | -4 | -12 | Consumer Cycl. | 5 | 0.1 |
| Total/Average | 634,808 | 1,177 | 1,182 | 8 | 7 | 712 |
Sources: SGX, Refinitiv, Bloomberg (Data as of 30 Nov 2022)^ note on SGX Watchlist
—
Originally Posted December 1, 2022 – Most Actives Average 7% Total Return in Nov, on S$700M of Net Fund Inflow
Disclosure: Interactive Brokers
Information posted on IBKR Campus that is provided by third-parties does NOT constitute a recommendation that you should contract for the services of that third party. Third-party participants who contribute to IBKR Campus are independent of Interactive Brokers and Interactive Brokers does not make any representations or warranties concerning the services offered, their past or future performance, or the accuracy of the information provided by the third party. Past performance is no guarantee of future results.
This material is from Singapore Exchange and is being posted with its permission. The views expressed in this material are solely those of the author and/or Singapore Exchange and Interactive Brokers is not endorsing or recommending any investment or trading discussed in the material. This material is not and should not be construed as an offer to buy or sell any security. It should not be construed as research or investment advice or a recommendation to buy, sell or hold any security or commodity. This material does not and is not intended to take into account the particular financial conditions, investment objectives or requirements of individual customers. Before acting on this material, you should consider whether it is suitable for your particular circumstances and, as necessary, seek professional advice.


